

GHE can lift 2026 marketing ROI +25% on a net-$0 budget by funding conversion, not cost. Full-funnel attribution across 13 channels, 2011–2025, computed bottom-up from atomic records.

1. THE ANSWER
Fund conversion, not cost a net-$0 reallocation, lifts 2026 ROI from 399% to 478%.
GHE invests around $3.75 million across 13 channels, and the machine creates 96,035 leads, 11,111 enrollments, $17.69 million paid revenue, blended ROAS 4.71x (from 2011 to 2025).
But the budget is set by lead volume and cost-per-lead (CPL), and CPL turns out to be the wrong compass:
1.1 Situation
$3.75M across 13 channels (2011–25): 96,035 leads, 7,207 enrolled, $15.46M revenue, blended ROI 312%.
1.2 Complication
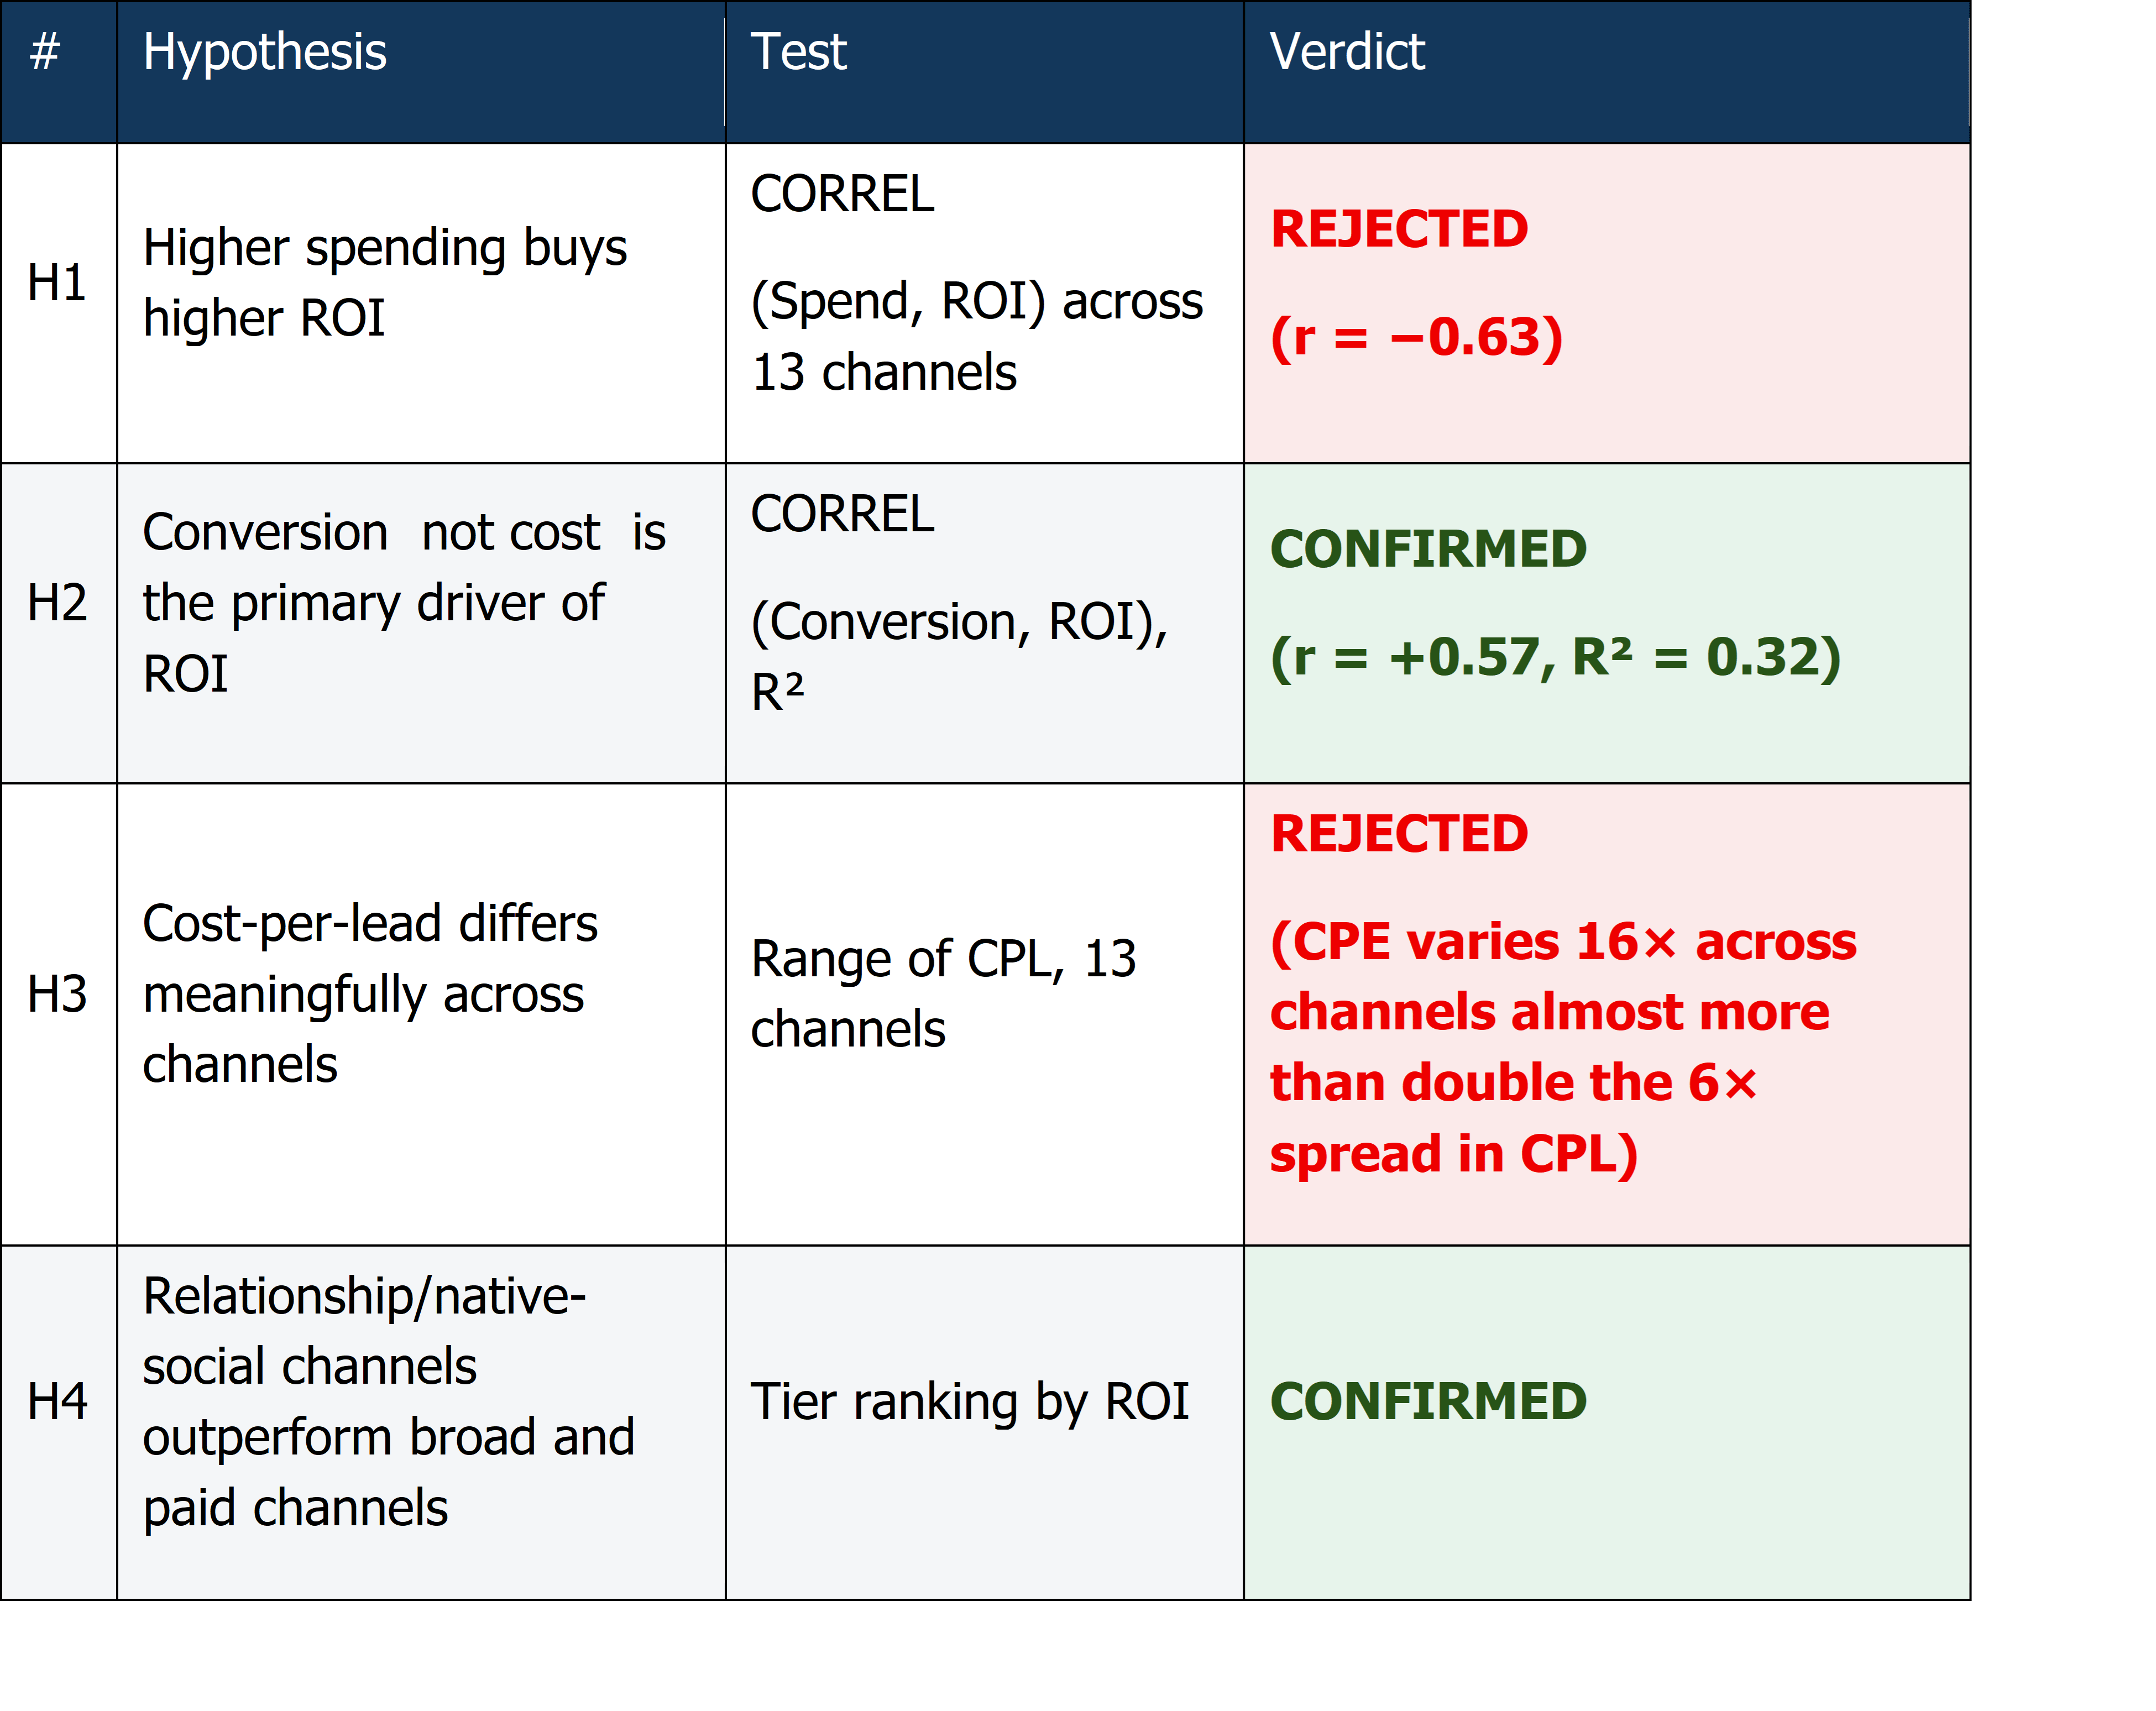
Spend and Return On Investment (ROI) move in opposite directions (r = −0.64) while Conversion drives ROI (r = -0.63, R² = 0.32). Cost-Per-Lead (CPL) varies a real 6× by channel ($12–$74); Cost-Per-Enrolment (CPE) varies 11× almost more than double, on the same conversion gap.
Only two channels are genuinely underwater
1.3 Resolution
Reallocate $60,565 (net-$0, 2025 base $632K) from Google Ads and Education Fair to the four channels that already carry the portfolio. 2026 ROI 505% → 593% (+17%). No new budget, no operational dependency.
2. WHAT WE TEST AND WHAT REJECTED
Four hypotheses, written down before the analysis, each with a kill criterion agreed in advance.
3. CHANNEL ECONOMICS
Nine findings, from a live PivotTable (Data Model), each verified against ground truth.
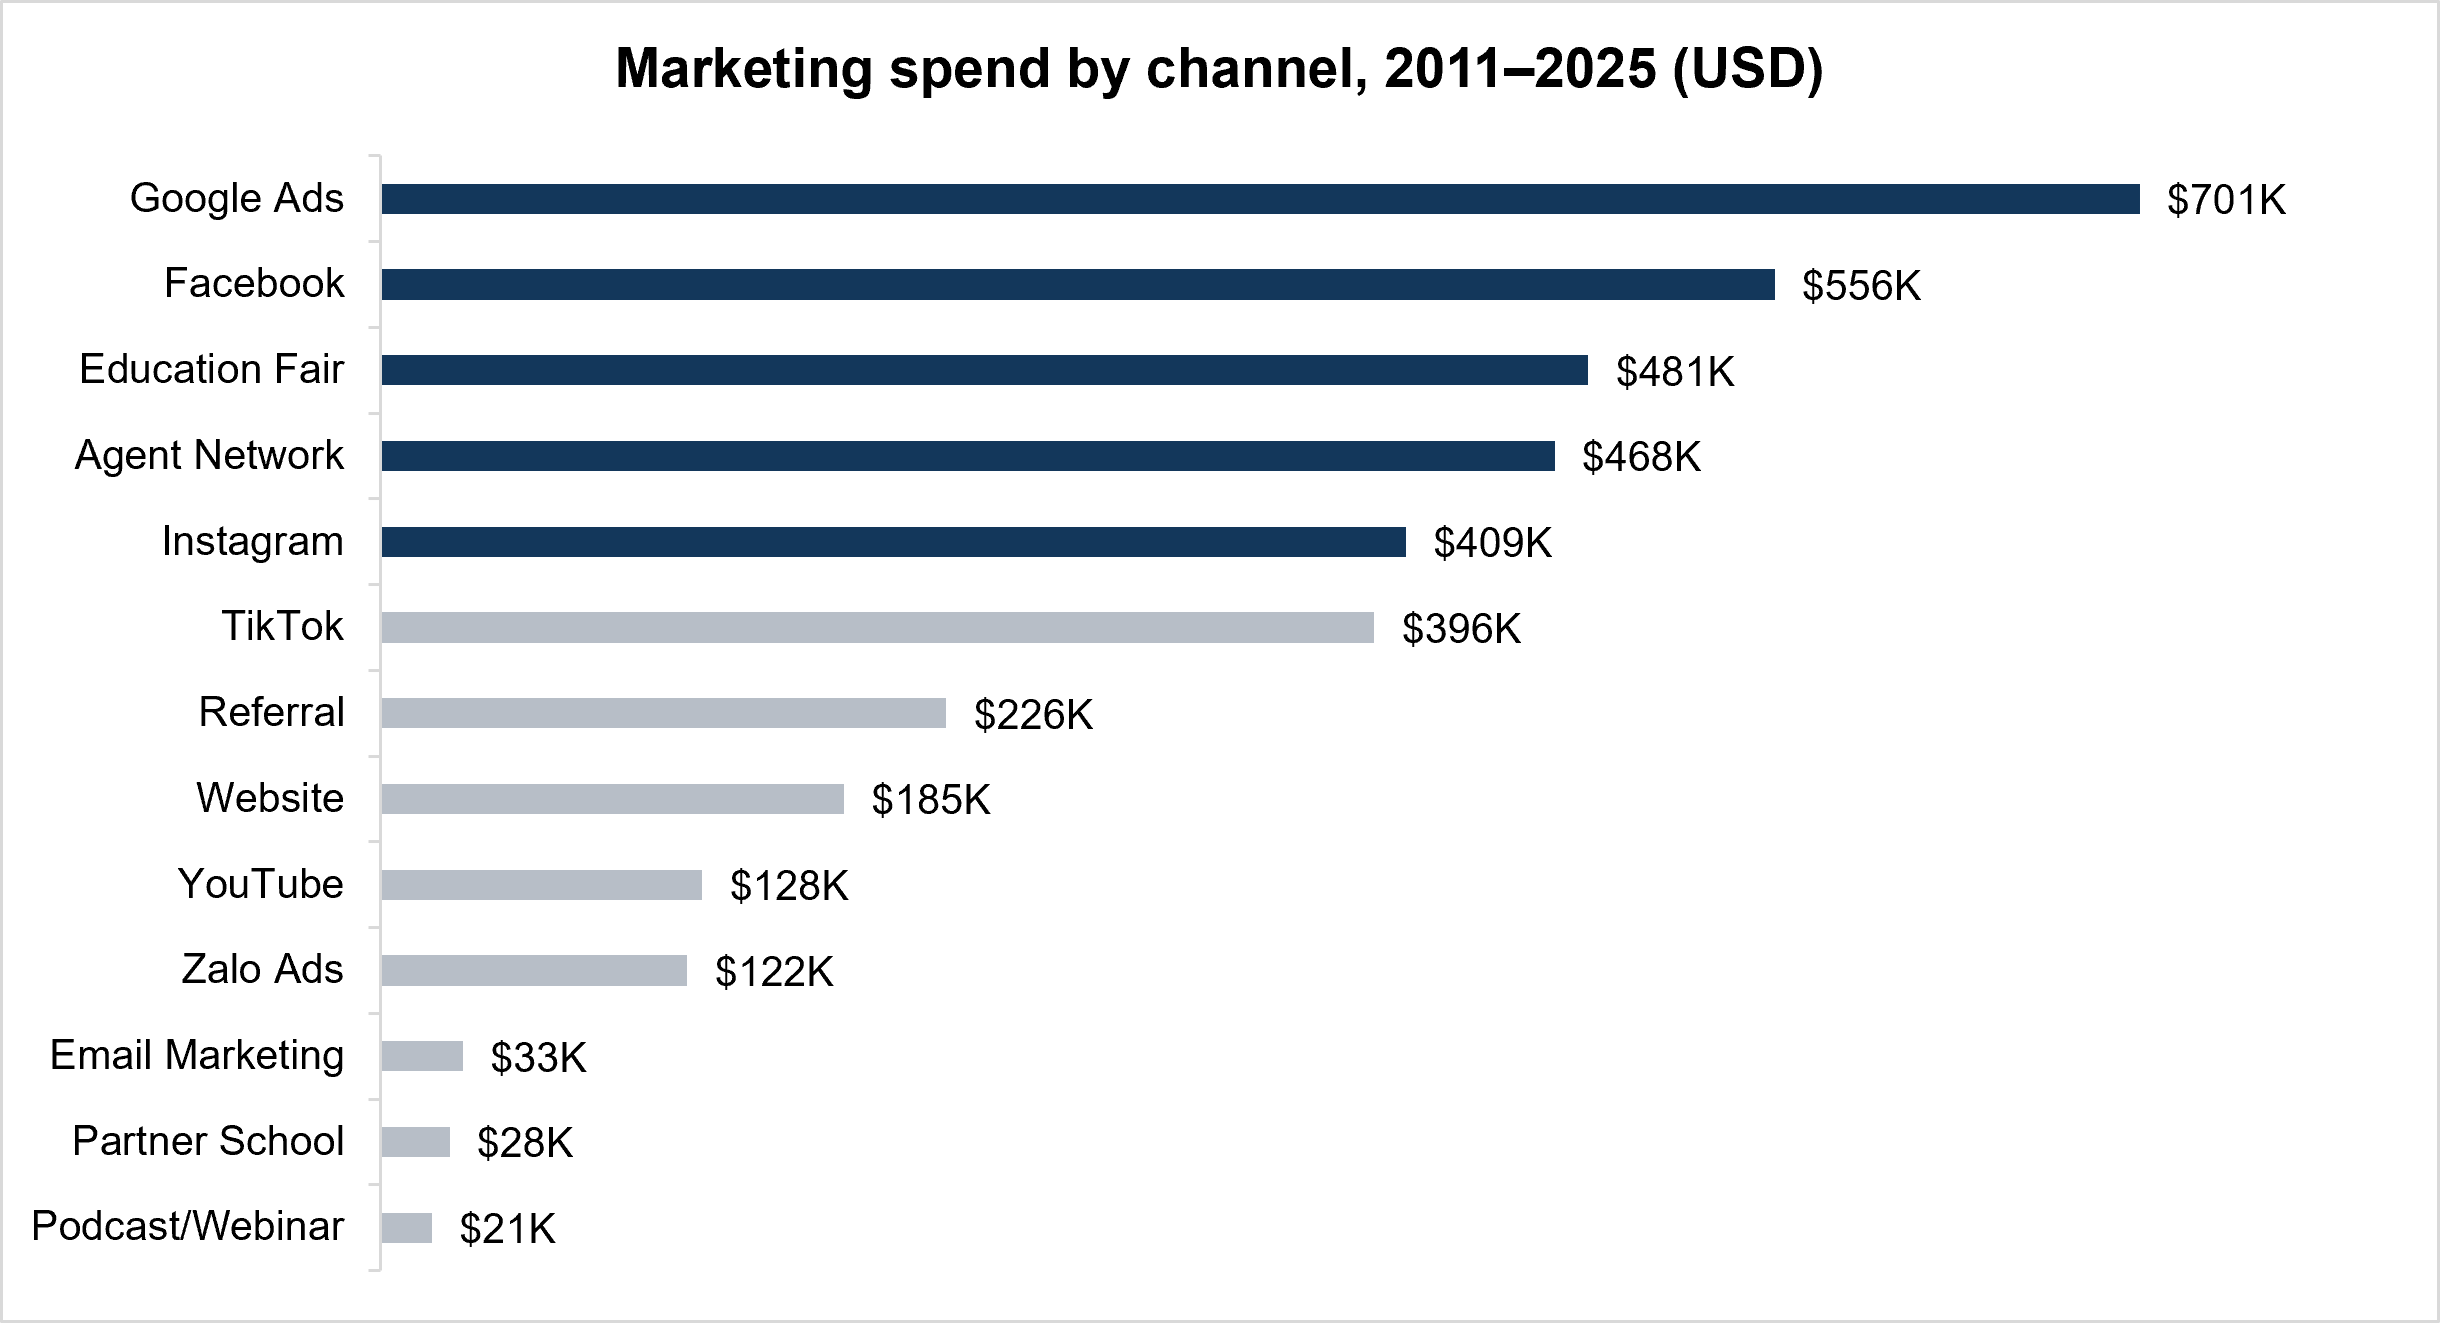
Exhibit 1: Five channels absorb 70% of spend and none of them is a top-ROI performer.
Source: GHE Dataset
Google Ads ($701K), Facebook ($556K), Education Fair ($481K), Agent Network ($468K) and Instagram ($396K) together account for $2.61M – 70% of the total budget $3.75M - and none of the five is a Scale-tier performer; all five sit in the Optimize-to-Cut range.
No channel’s spend is grandfathered in for 2026 just because it is already large every line is re-tested against return before the budget is set.
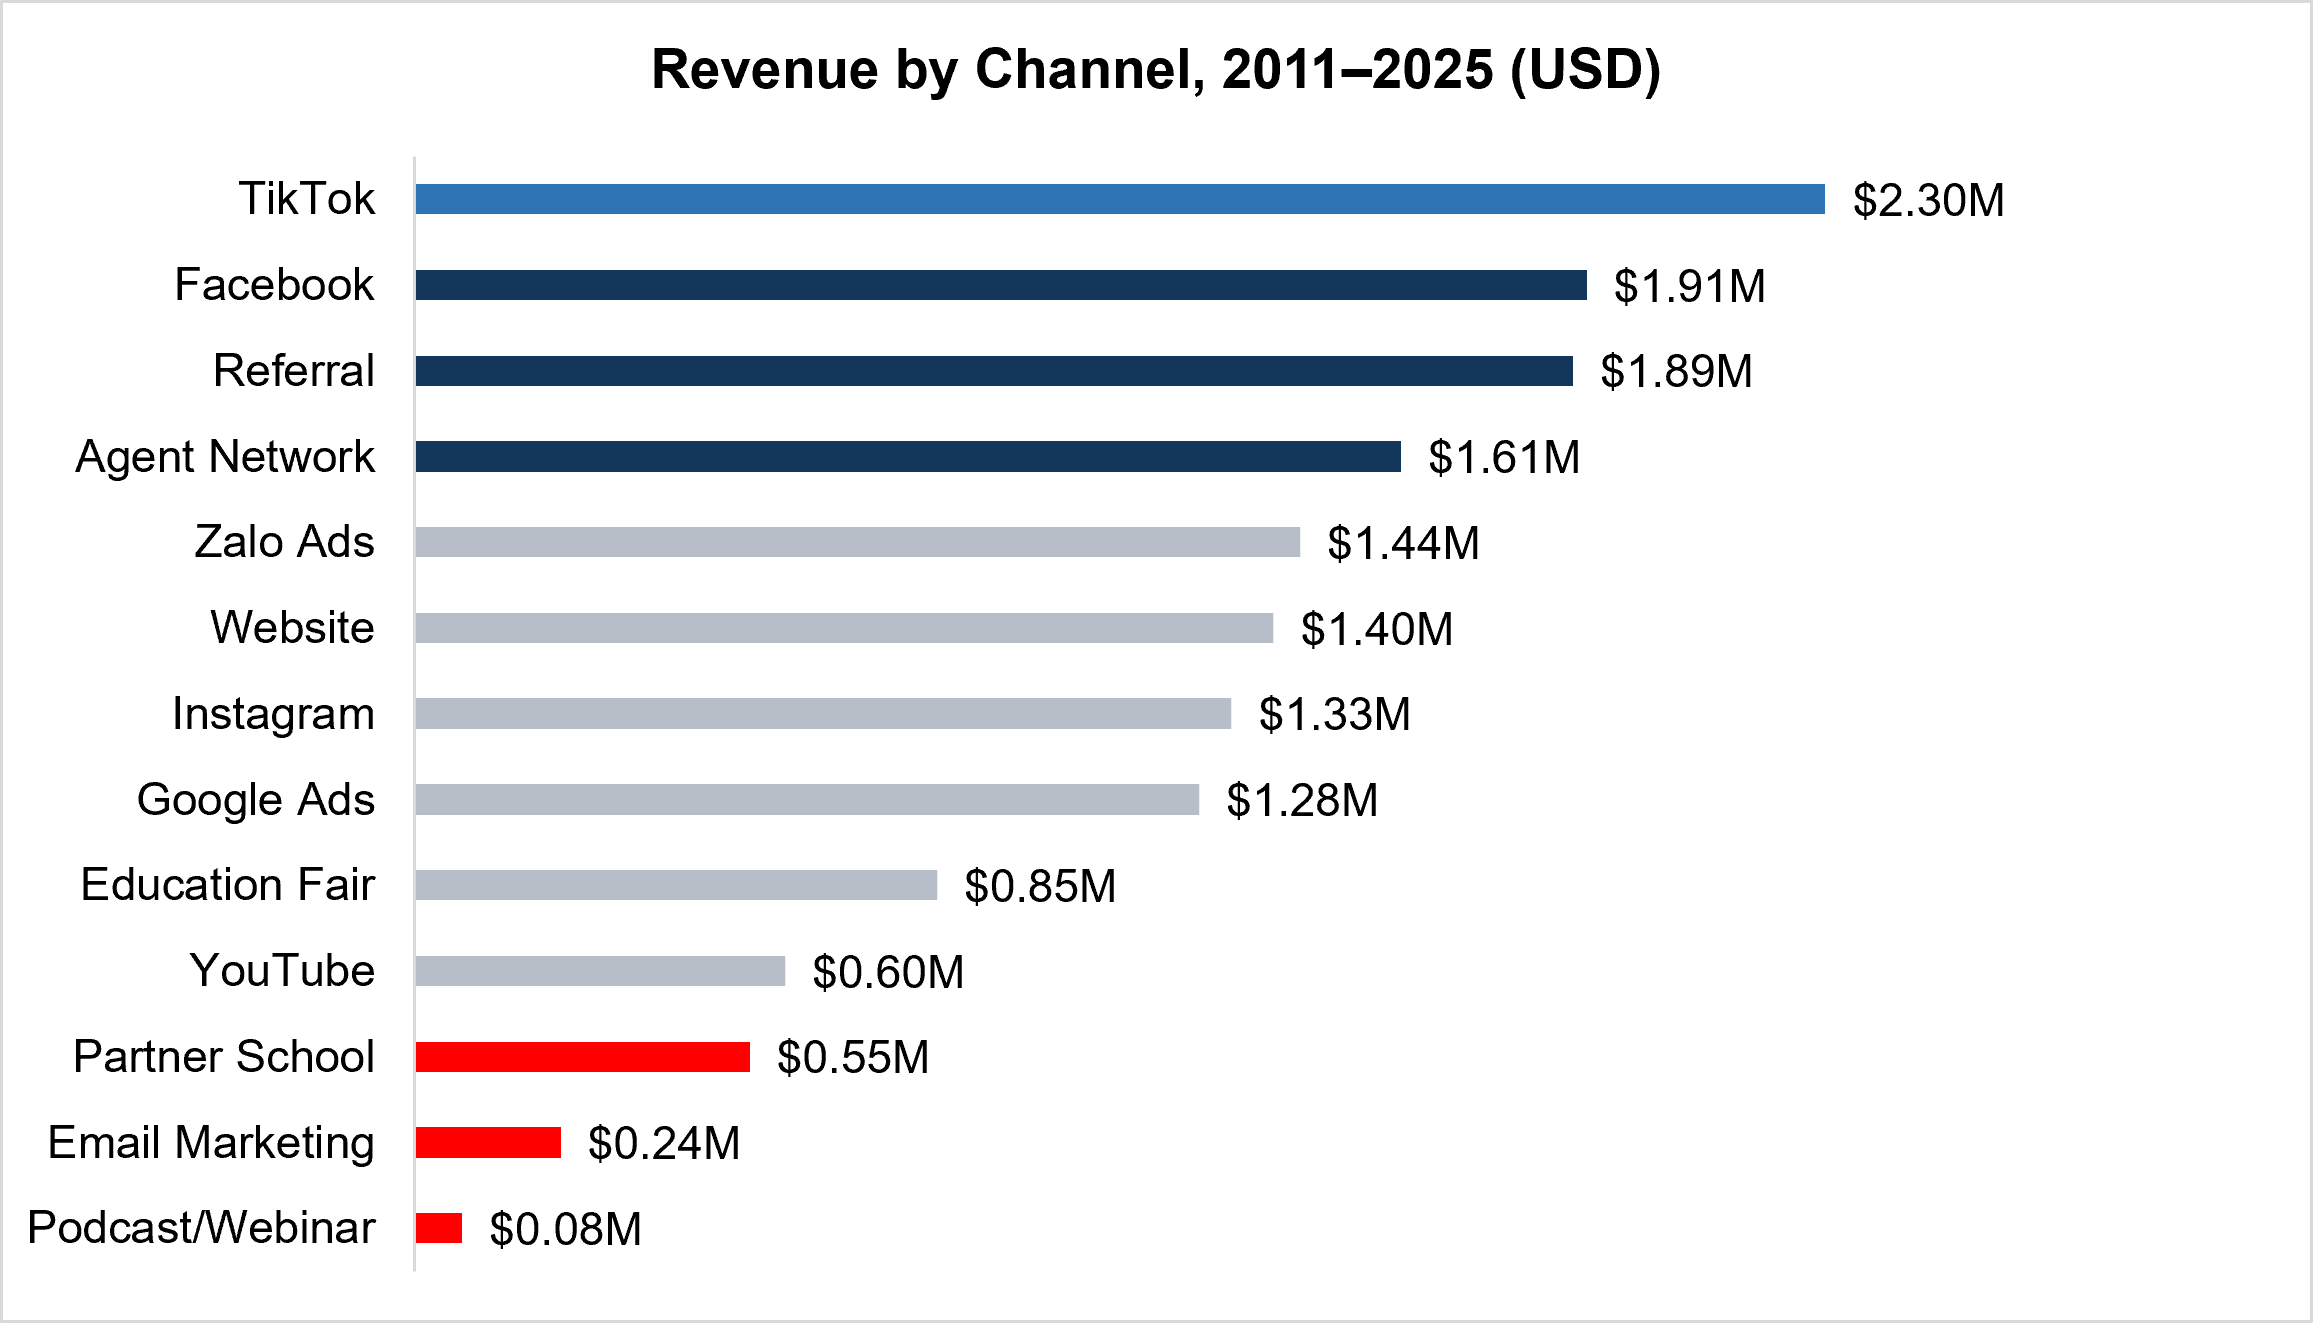
Exhibit 2: TikTok turns $396K of spend into $2.30M of revenue - more than any other channel.
Source: GHE Dataset
TikTok ($2.30M), Facebook ($1.91M), Referral ($1.89M), Agent Network ($1.61M) and Zalo Ads ($1.44M) lead revenue. TikTok tops the list despite ranking only 6th in spend.
Spend rank and revenue rank are different rankings entirely; every budget conversation should open with the revenue ranking, not the spend one.
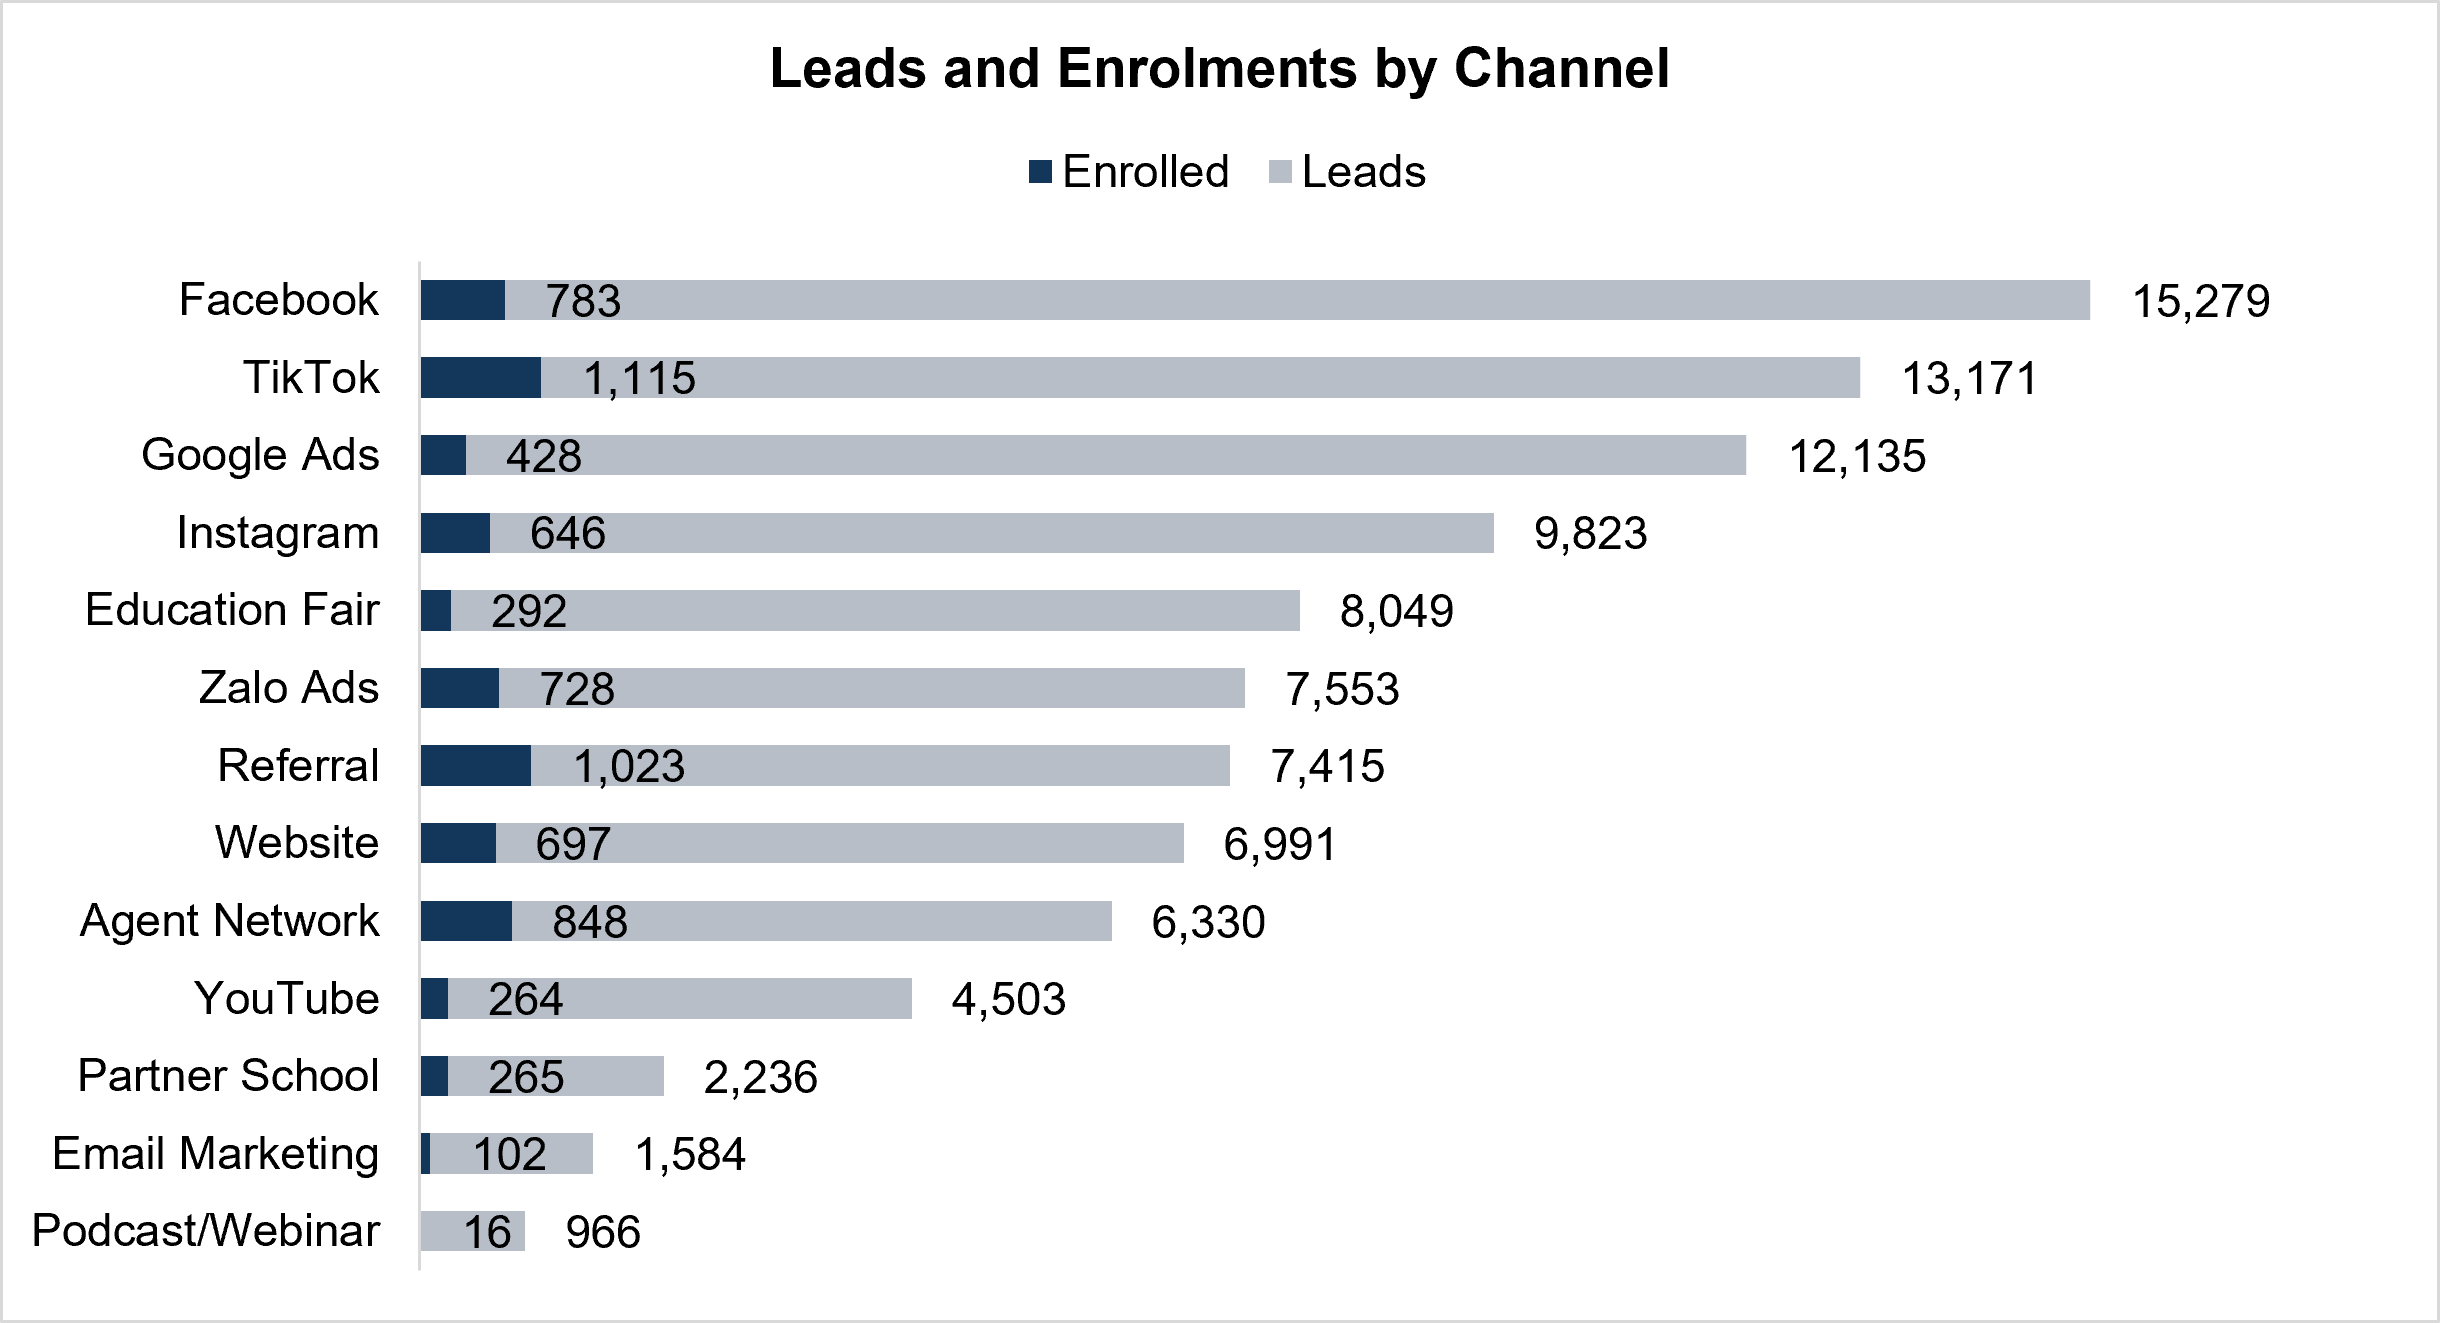
Exhibit 3: Facebook brings the most leads (15,279) but converts only 5.1% - below the 7.5% average.
Source: GHE Dataset
Facebook generates the most leads of any channel (15,279) but converts just 783 of them 5.1%, below the 7.5% blended average while TikTok converts 13,171 leads at a stronger 8.5%.
Lead count on its own is a vanity metric; no channel should be judged on volume without its conversion rate reported alongside it.
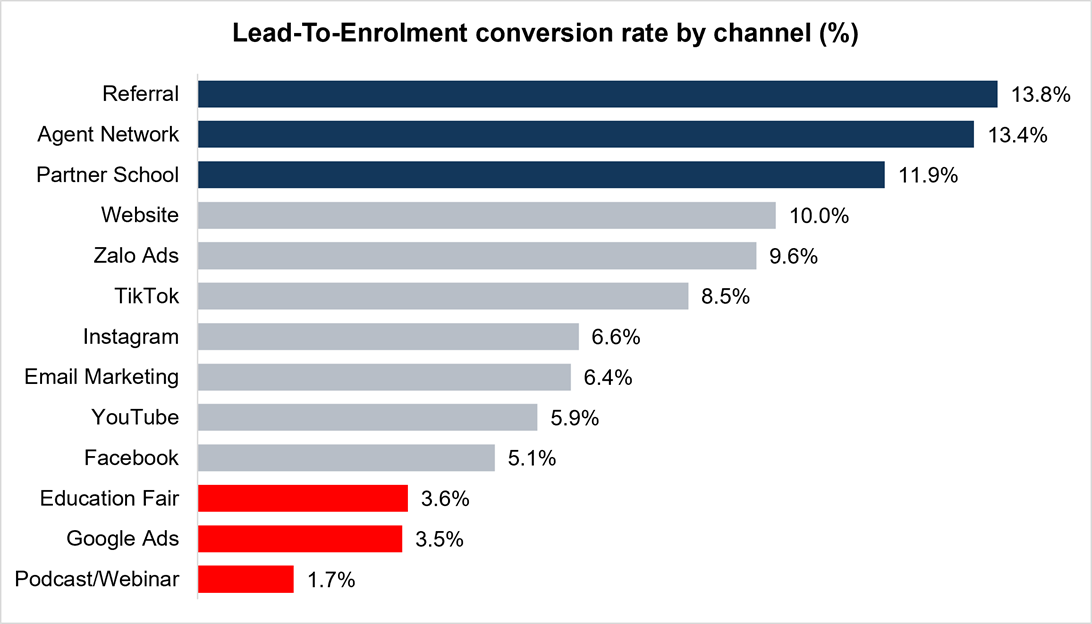
Exhibit 4: Partner School converts 11.9% of leads, 3.3× Education Fair’s rate, on a quarter of the leads.
Source: GHE Dataset
Partner School converts 11.9% of its 2,236 leads; Education Fair converts just 3.6% of its 8,049, 3.3× higher despite roughly a quarter as many leads.
Conversion is the cleanest differentiator in the scorecard, so no channel gets a budget increase below a 5% conversion floor without specific justification.
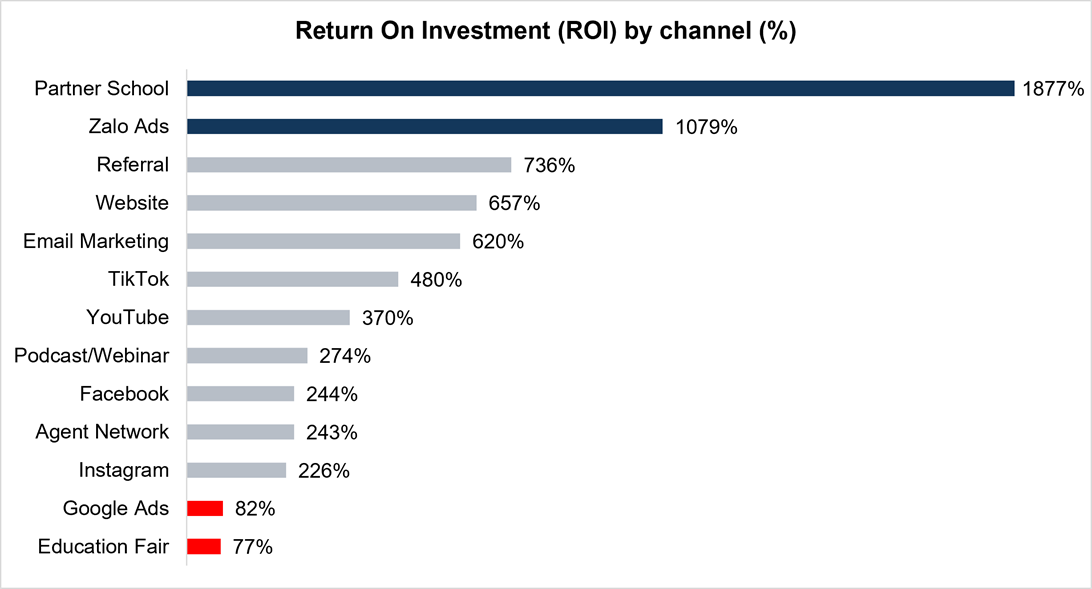
Exhibit 5: ROI ranges 1,877% to 77% - but only two channels are underwater.
Source: GHE Dataset
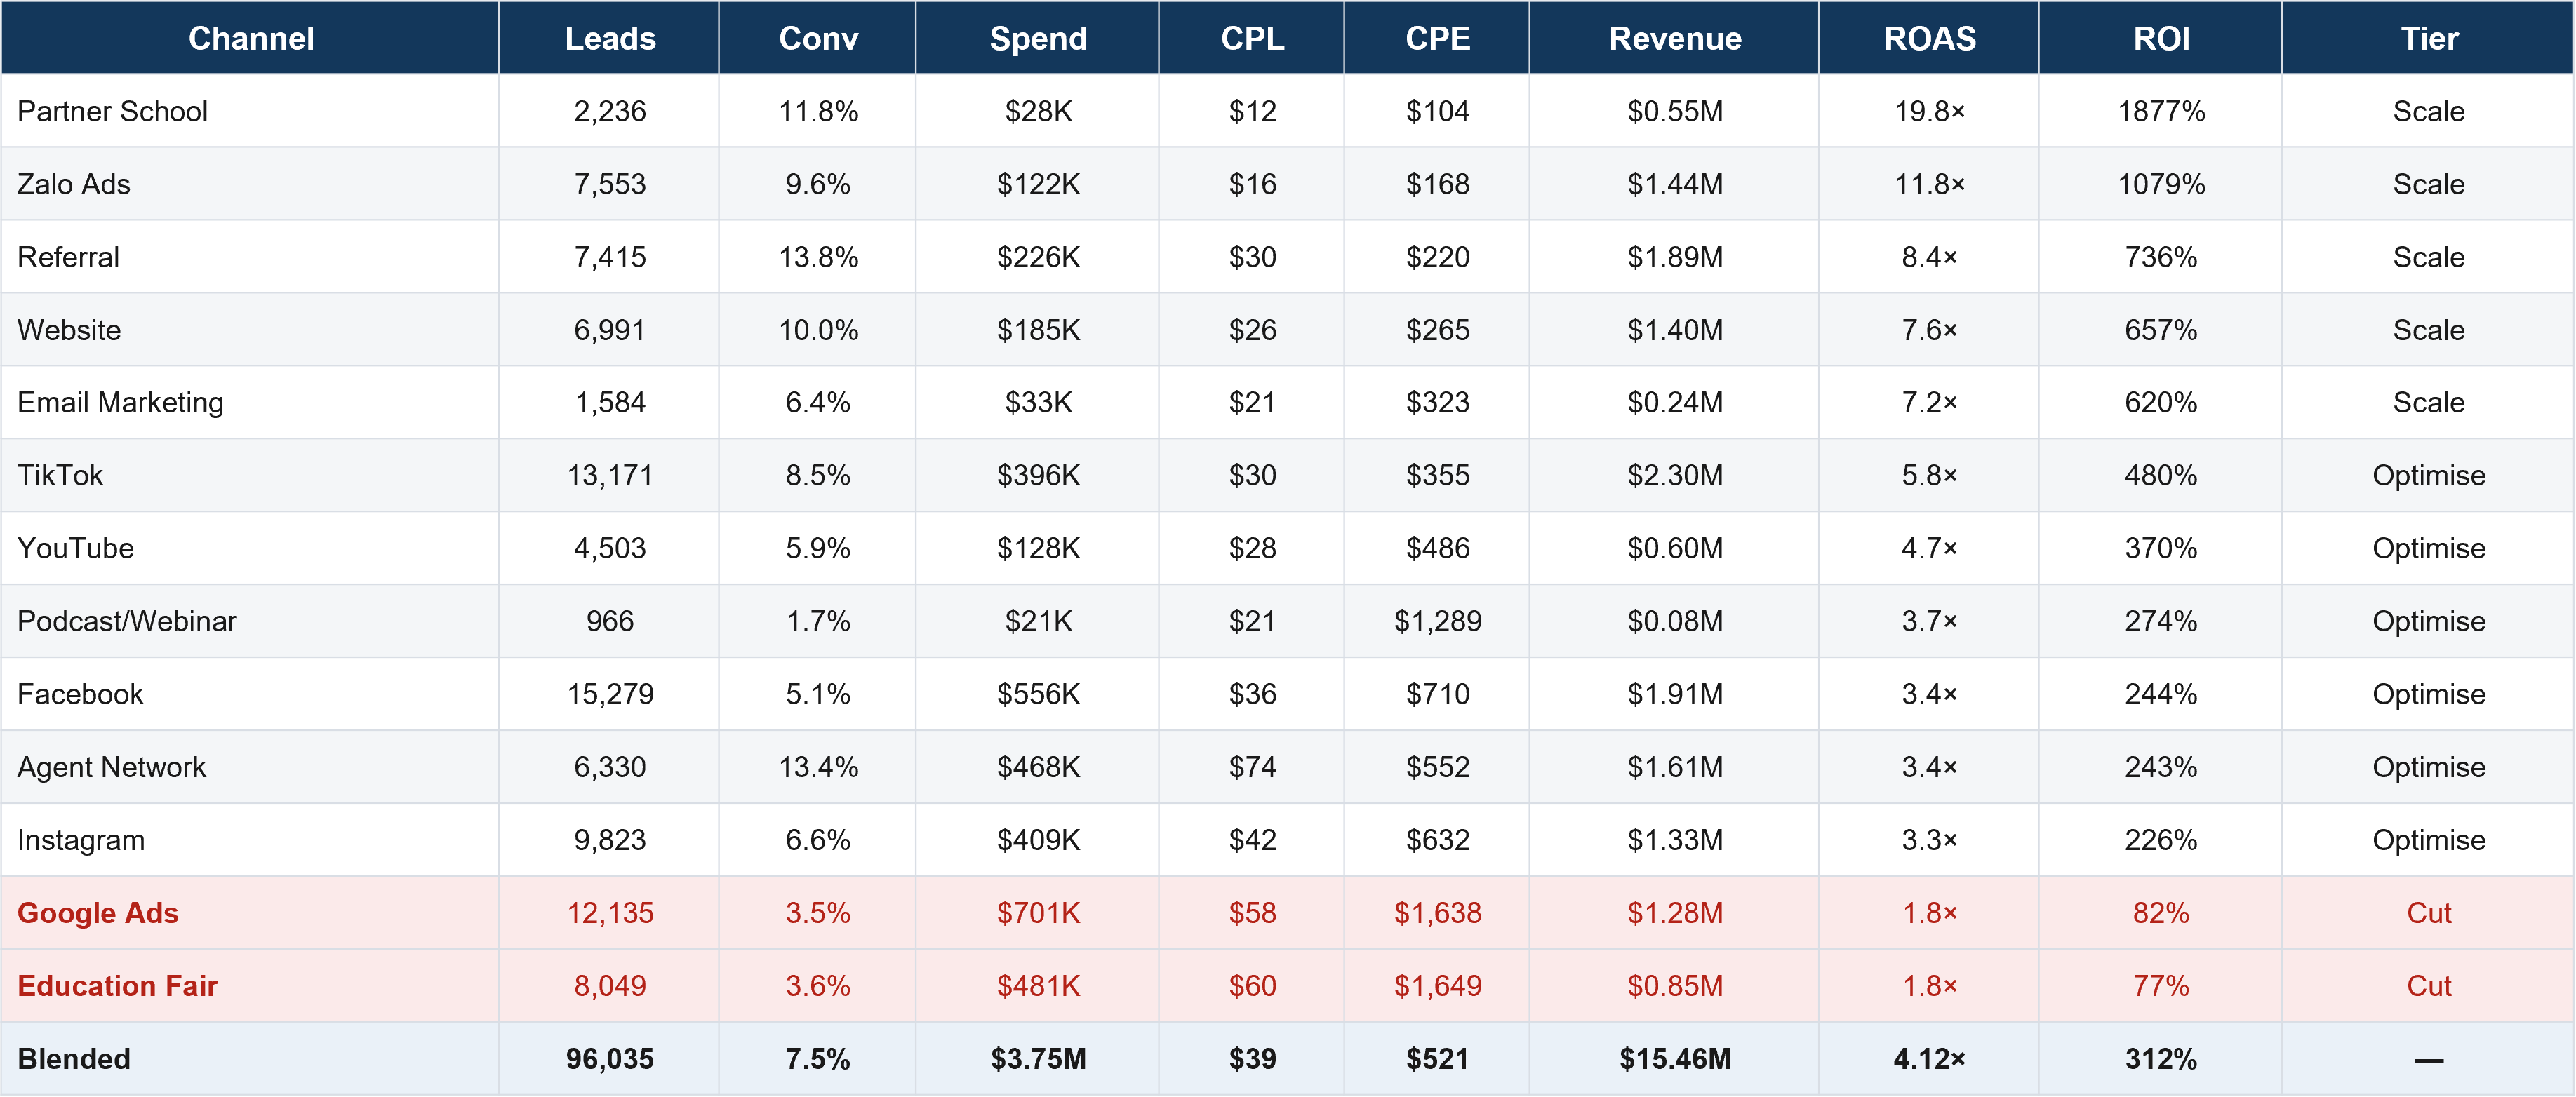
Five channels clear the 500% Scale threshold - Partner School (1,877%), Zalo Ads (1,079%), Referral (736%), Website (657%) and Email Marketing (620%) - six more, including TikTok (480%), sit in a 226–480% Optimize band, and only Google Ads (82%) and Education Fair (77%) fall below break-even-plus-margin.
This ranking, not spend size, opens every 2026 budget conversation - the portfolio isn’t broken; two specific channels are, and the fix is narrow.
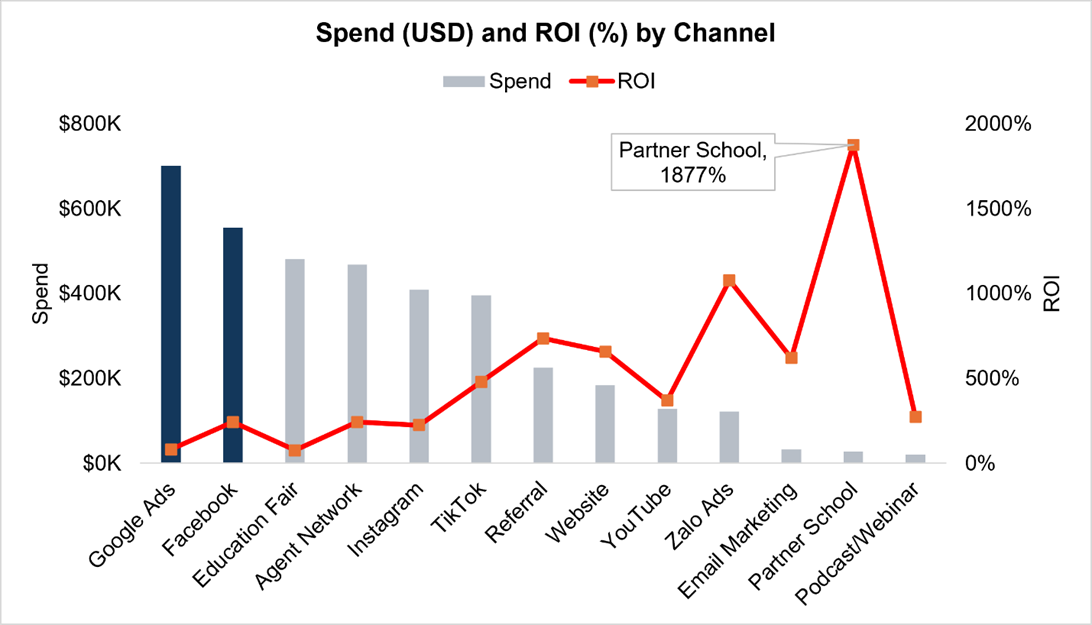
Exhibit 6: Google Ads and Education Fair: the two largest budgets, the two weakest returns.
Source: GHE Dataset
Google Ads ($701K spend, 82% ROI) and Education Fair ($481K spend, 77% ROI) are simultaneously two of the four biggest budget lines and the two weakest performers -spend and ROI move in opposite directions across the portfolio (r = −0.63).
No channel receives new spend below 200% ROI without an explicit waiver from the Marketing Director and CFO.
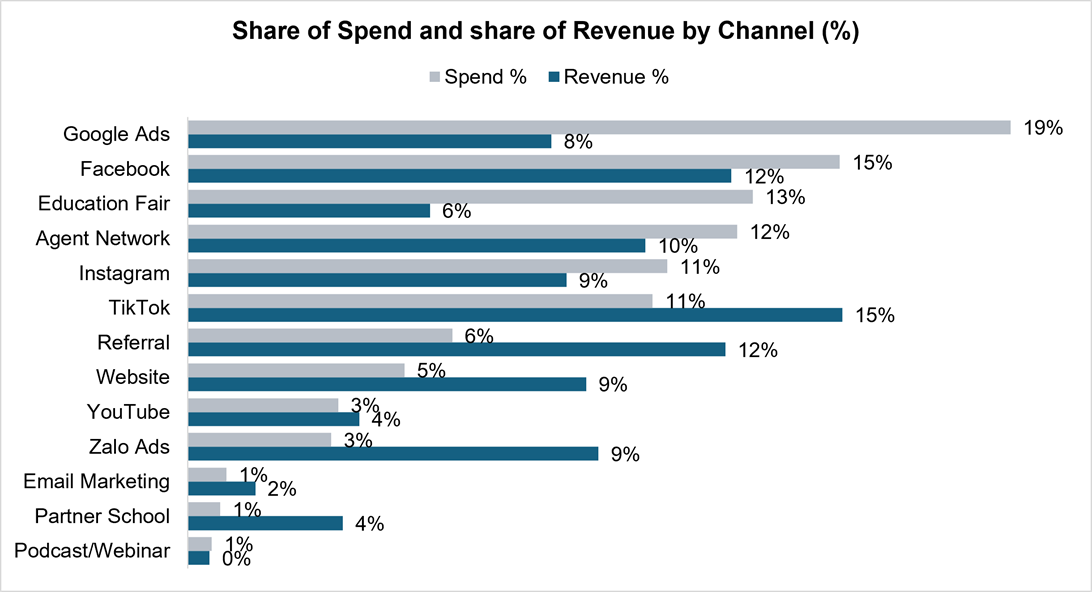
Exhibit 7: Google Ads takes 18.7% of budget for 8.3% of revenue the widest gap in the portfolio
Source: GHE Dataset
Google Ads takes 18.7% of spend for 8.3% of revenue, a −10.4-point gap; Referral runs the opposite way, at 6.0% of spend for 12.2% of revenue.
The 2026 plan re-bases each channel’s spend-share toward its revenue-share, closing the largest gaps first, with a target of ±2pp within two quarters.
Exhibit 8: Conversion tracks ROI across channels but explains only a third of the variation
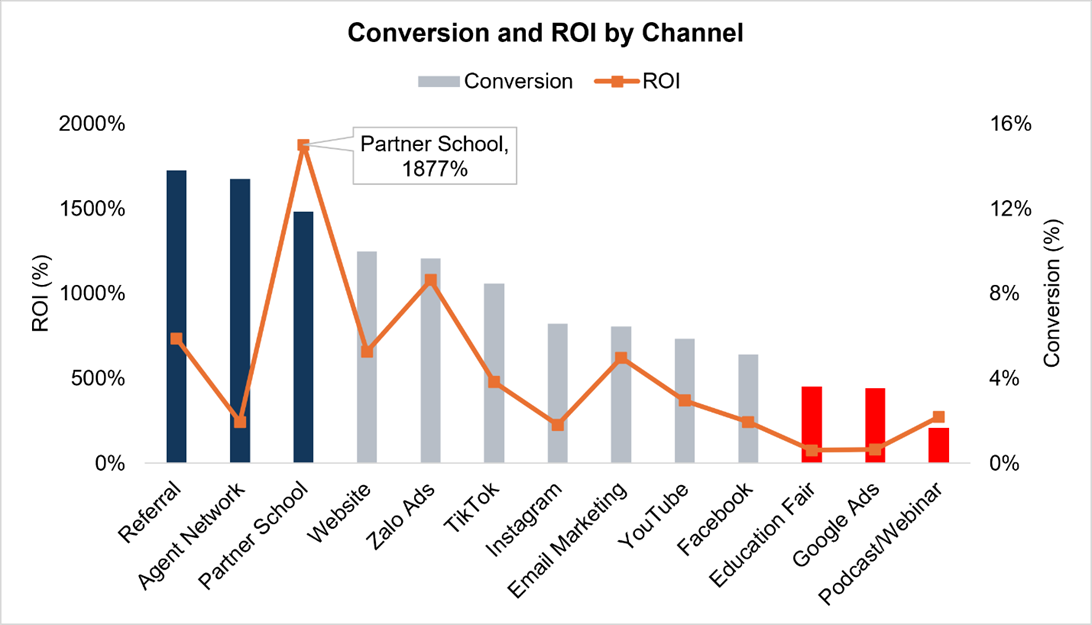
Referral (13.8% conversion) and Partner School (11.9%) both post top-3 conversion and top-3 ROI but Agent Network breaks the pattern: its 13.4% conversion is the second highest of any channel, yet its ROI (243%) lands mid-pack, dragged down by the highest CPL in the portfolio ($74, Exhibit 9). Conversion alone explains 32% of the variation in ROI (R² = 0.32) real, but partial.
Conversion is still a better filter than spending size for any budget increase, but it isn’t the whole story on its own - lead quality (Exhibit 14) and cost discipline (Exhibit 9) both carry real weight too.
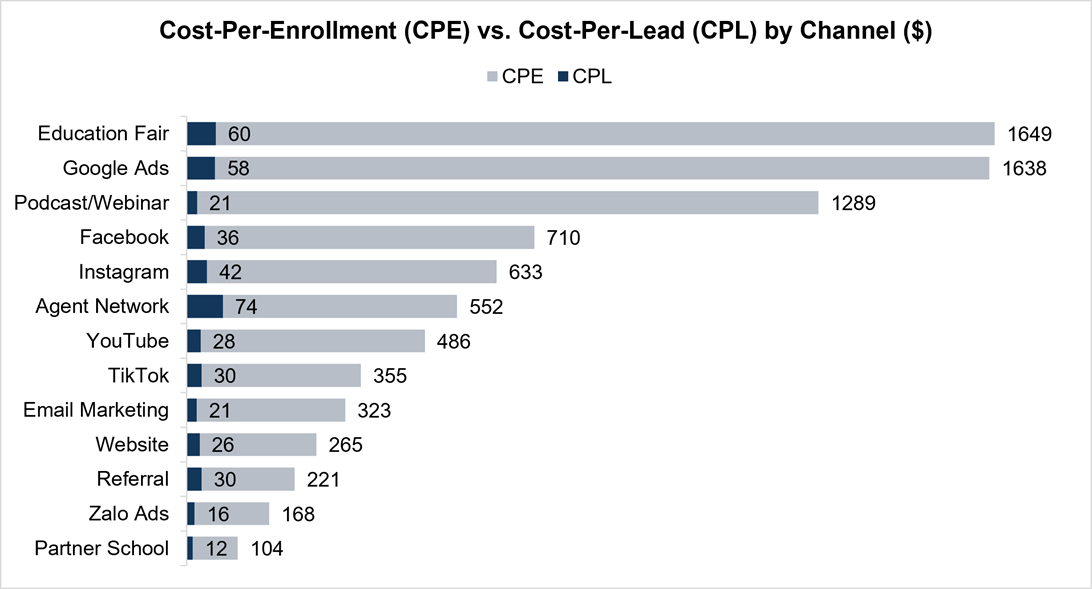
Exhitbit 9: Cost Per Enrolment (CPE) varies nearly 16× across Channels far more than the 6× spread in Cost Per Lead (CPL).
Source: GHE Dataset
CPL ranges $12–$74 across the 13 channels - a real 6× spread while CPE (cost per enrolment) ranges $104 (Partner School) to $1,649 (Education Fair), nearly 16× - a much wider gap than CPL alone would suggest.
Conversion is what widens the gap: Agent Network carries the highest CPL of any channel ($74) but a mid-pack CPE ($552), on a strong 13.4% conversion rate - while Education Fair’s lower CPL ($60) still produces the highest CPE in the portfolio ($1,649), on a weak 3.6% conversion rate. CPE, not CPL, should be the primary cost KPI, with a ceiling at roughly 1.3× blended (~$680).
4. TARGETING AND CREATIVE
One finding on creative format, drawn from a Channel × Creative-Type cross-tab.
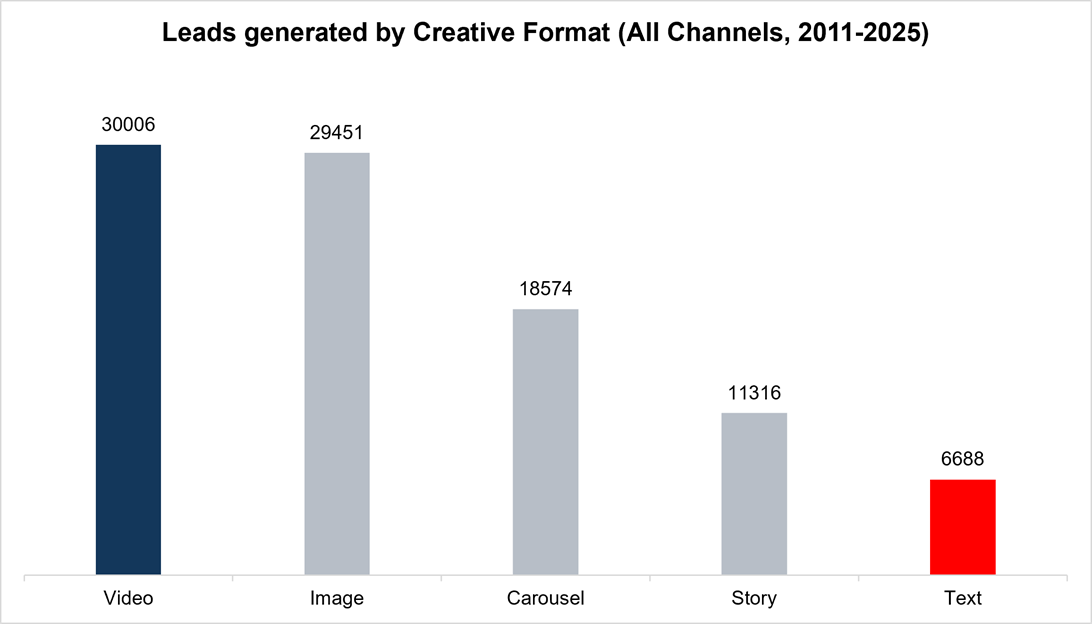
Exhibit 10: Video and Image together drive 62% of all leads Text is the weakest format in every channel.
Source: GHE Dataset
Video (30,006 leads) and Image (29,451) together account for 61.9% of the 96,035 total; Text (6,688) is the smallest category in every channel it appears in, with Story (11,316) also trailing.
Reshaping new-campaign creative mix toward Video and Image buys more leads at no extra costthe same budget, better shaped.
5. TIME, GEOGRAPHY, AND QUALITY
Four findings on when demand happens, where it comes from, and which channels bring the best leads.
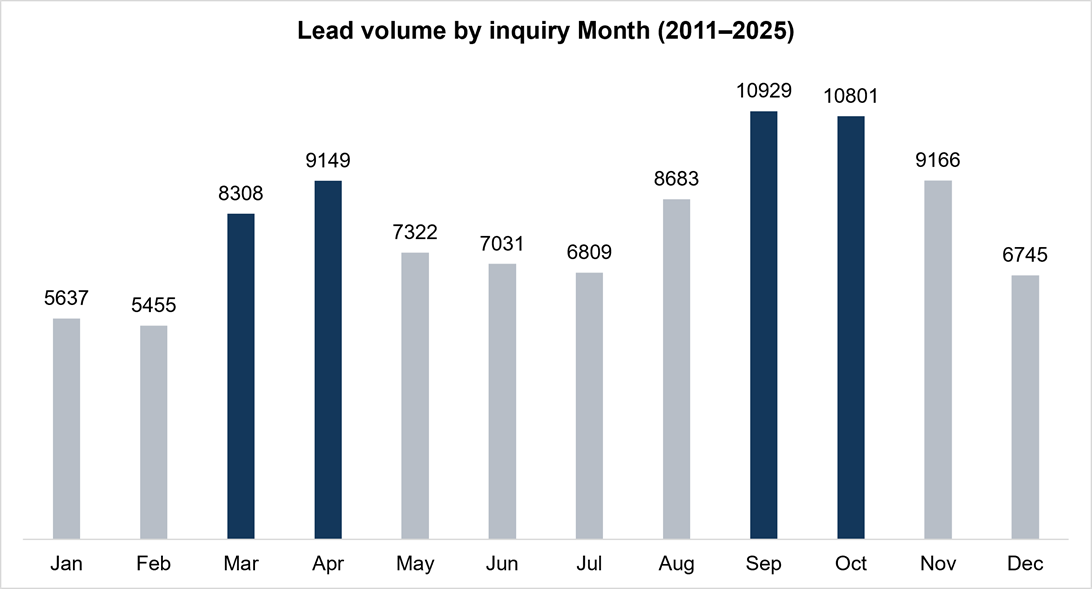
Exhibit 11: Demand is strongly seasonal, and timing is free ROI.
Source: GHE Dataset
Two demand peaks (Mar–Apr: 8,308 + 9,149; Sep–Oct: 10,929 + 10,801) and a Jan–Feb trough (5,637 + 5,455) align to AU/EU intake calendars and Tết (Lunar New Year), but flat month-by-month budgeting spends the same in low- and high-conversion months.
Shifting ~30% of the annual digital budget into the two peak windows raises blended ROI at zero extra spend the cheapest lever in this report.
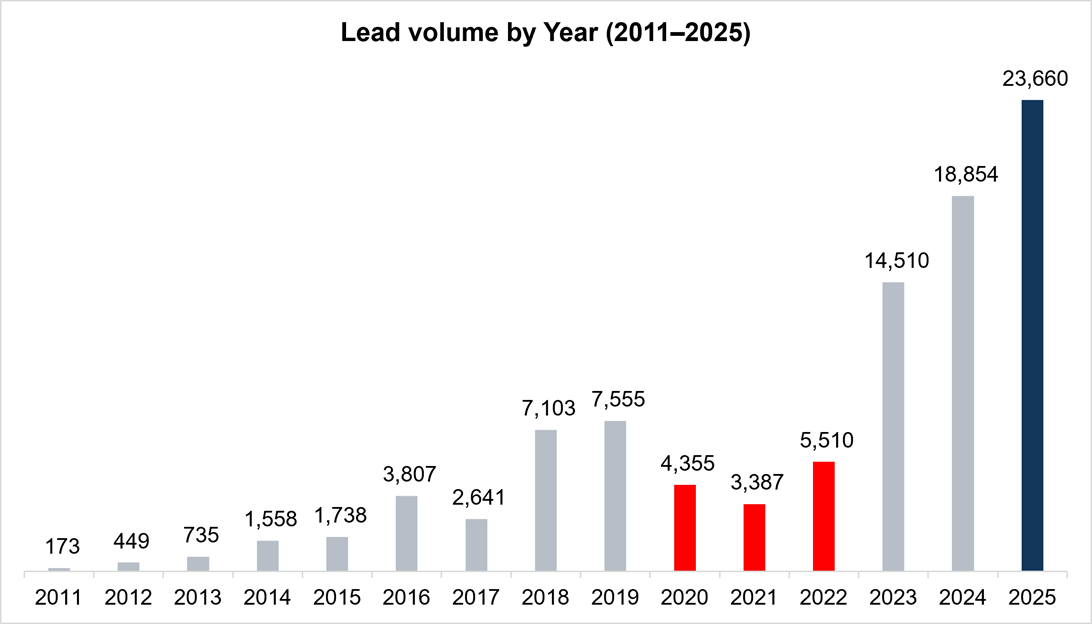
Exhibit 12: COVID cut lead volume 55% the recovery is a record, not a rebound.
Source: GHE Dataset
Lead volume fell from 7,555 (2019) to 3,387 (2021), a 55% drop, then recovered to a record 23,660 in 2025 more than 3× the pre-COVID peak.
The scale of that recovery argues for a standing playbook rather than relying on the next shock to resolve the way this one did: a pre-agreed trigger (leads −20% YoY for two consecutive months) and a 15% unallocated buffer.
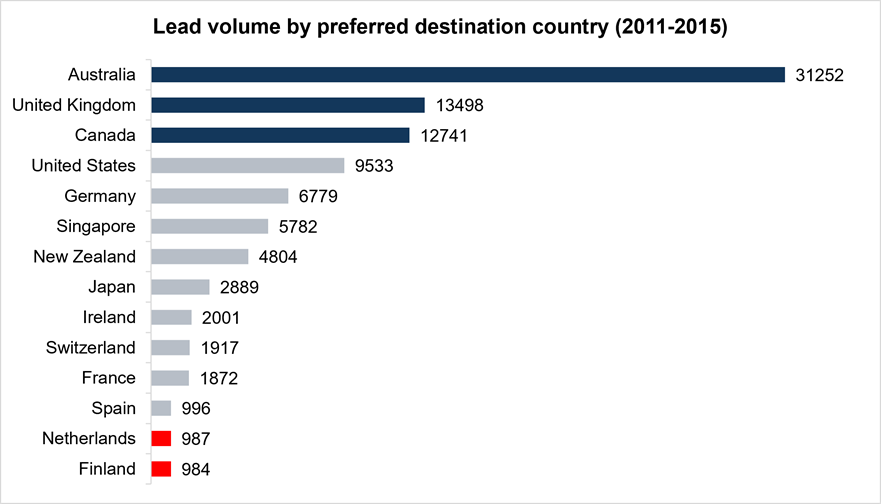
Exhibit 13: Four markets drive 70% of demand but destination barely predicts conversion.
Source: GHE Dataset
Australia (31,252), the UK (13,498), Canada (12,741) and the US (9,533) account for 70% of all 96,035 leads by preferred country, but conversion is nearly flat across all 14 markets.
This is a capacity-planning fact, not a marketing-budget lever, reallocation decisions should not rest on preferred-country volume alone.
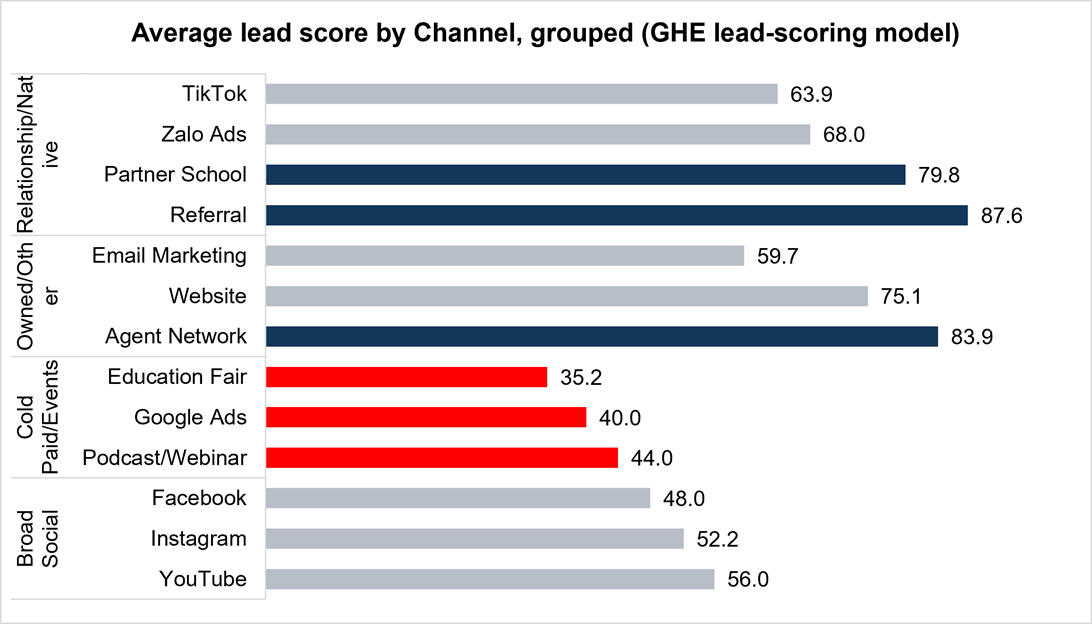
Exhibit 14: Referral scores highest on lead quality (87.6) Education Fair lowest (35.2), a 2.5× gap.
Source: GHE Dataset
Referral leads the portfolio on average lead score (87.6), followed by Agent Network (83.9) and Website (75.1); Education Fair (35.2), Google Ads (40.0) and Podcast/Webinar (44.0) - all Cold-Paid/Events channels lowest score.
Lead quality reinforces the same relationship-vs-cold-paid split already seen in conversion and ROI, funding follows quality in sequence with the Exhibit 5–9 reallocation.
6. PROGRAM FIT
Lead demand by program, a volume view for capacity and creative-supply planning.
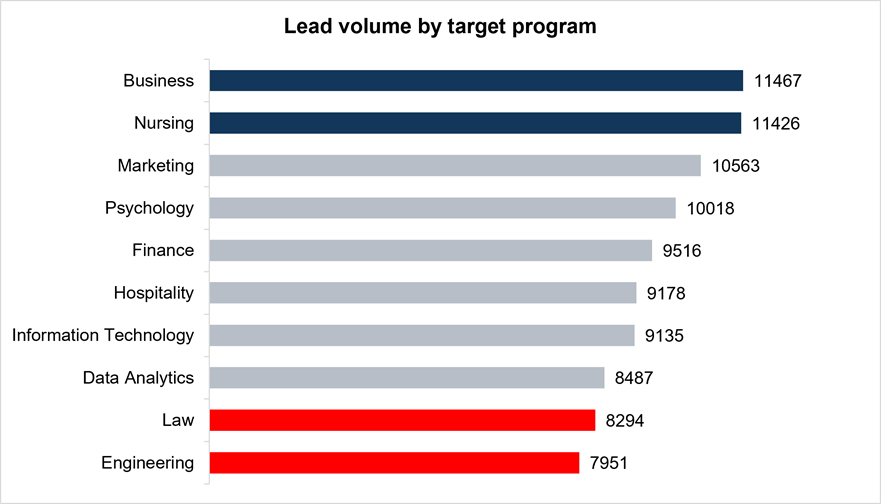
Exhibit 15: Business generates the most leads (11,467) and Engineering the fewest (7,951), a 44% gap
Source: GHE Dataset
Business (11,467) and Nursing (11,426) draw the most leads of the 10 programs ECG promotes; Engineering (7,951) and Law (8,294) draw the fewest a 44% gap between the top and bottom program by volume.
This is a volume view for capacity and creative-supply planning, not a proxy for program value treating it as one requires a conversion cut this report doesn’t make.
7. THE 2026 PLAN
$60,565 moves from the two genuinely underwater channels to the four that already carry the portfolio.
7.1 Who funds whom
Applied to the 2025-actual base ($632K, not the pooled 11-year total see Appendix X.3). Facebook, Instagram and Podcast/Webinar are held flat once ROI is computed correctly via the Data Model, they are not underwater.
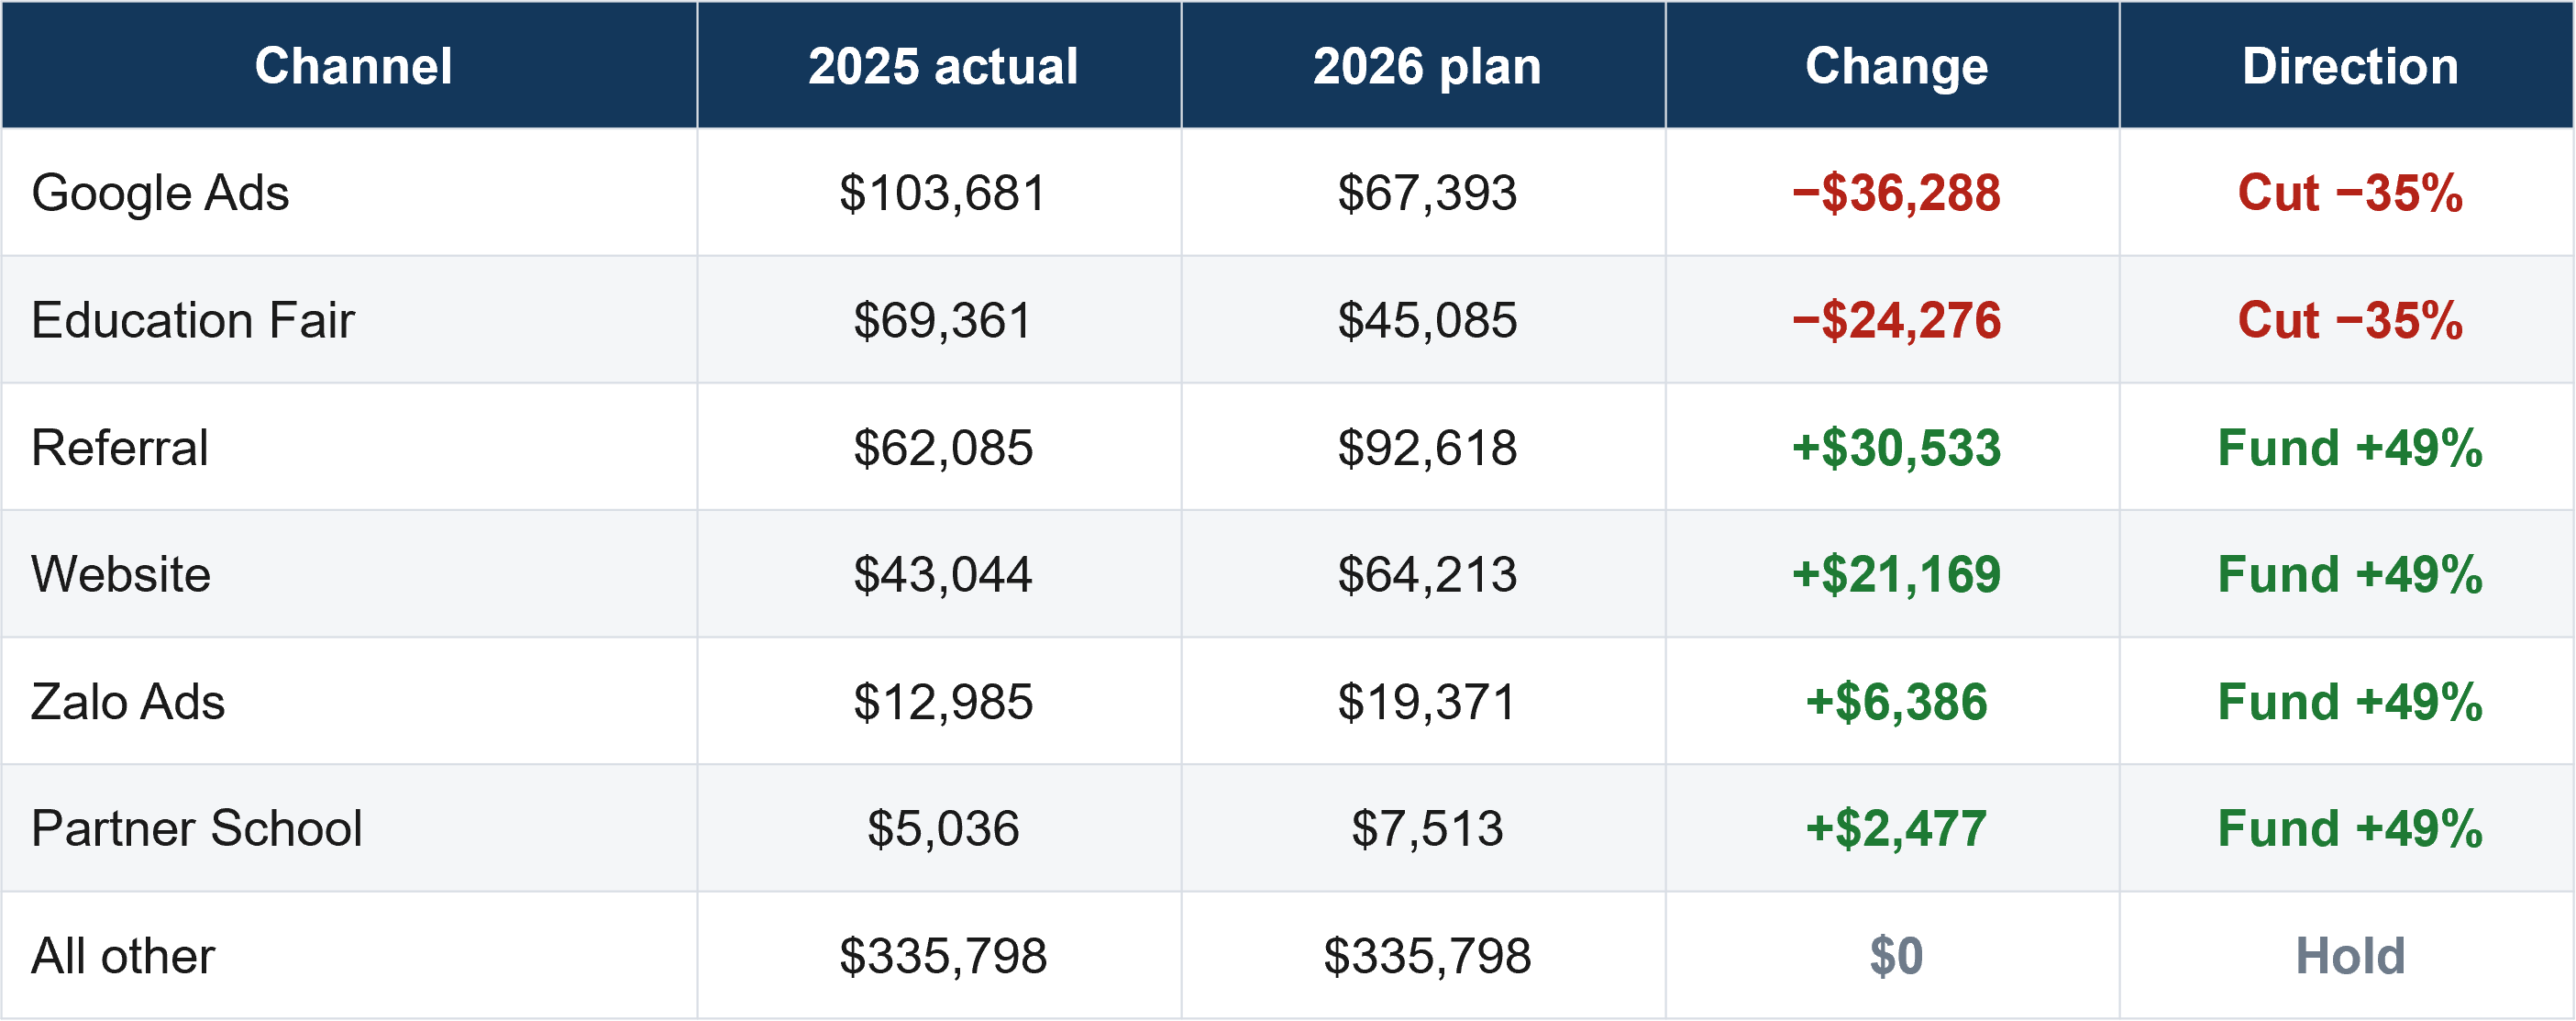
Net-$0, verified
Total 2025 = Total 2026 = $631,991 the $60,565 moves between existing lines; the portfolio total does not change.
7.2 What it is worth
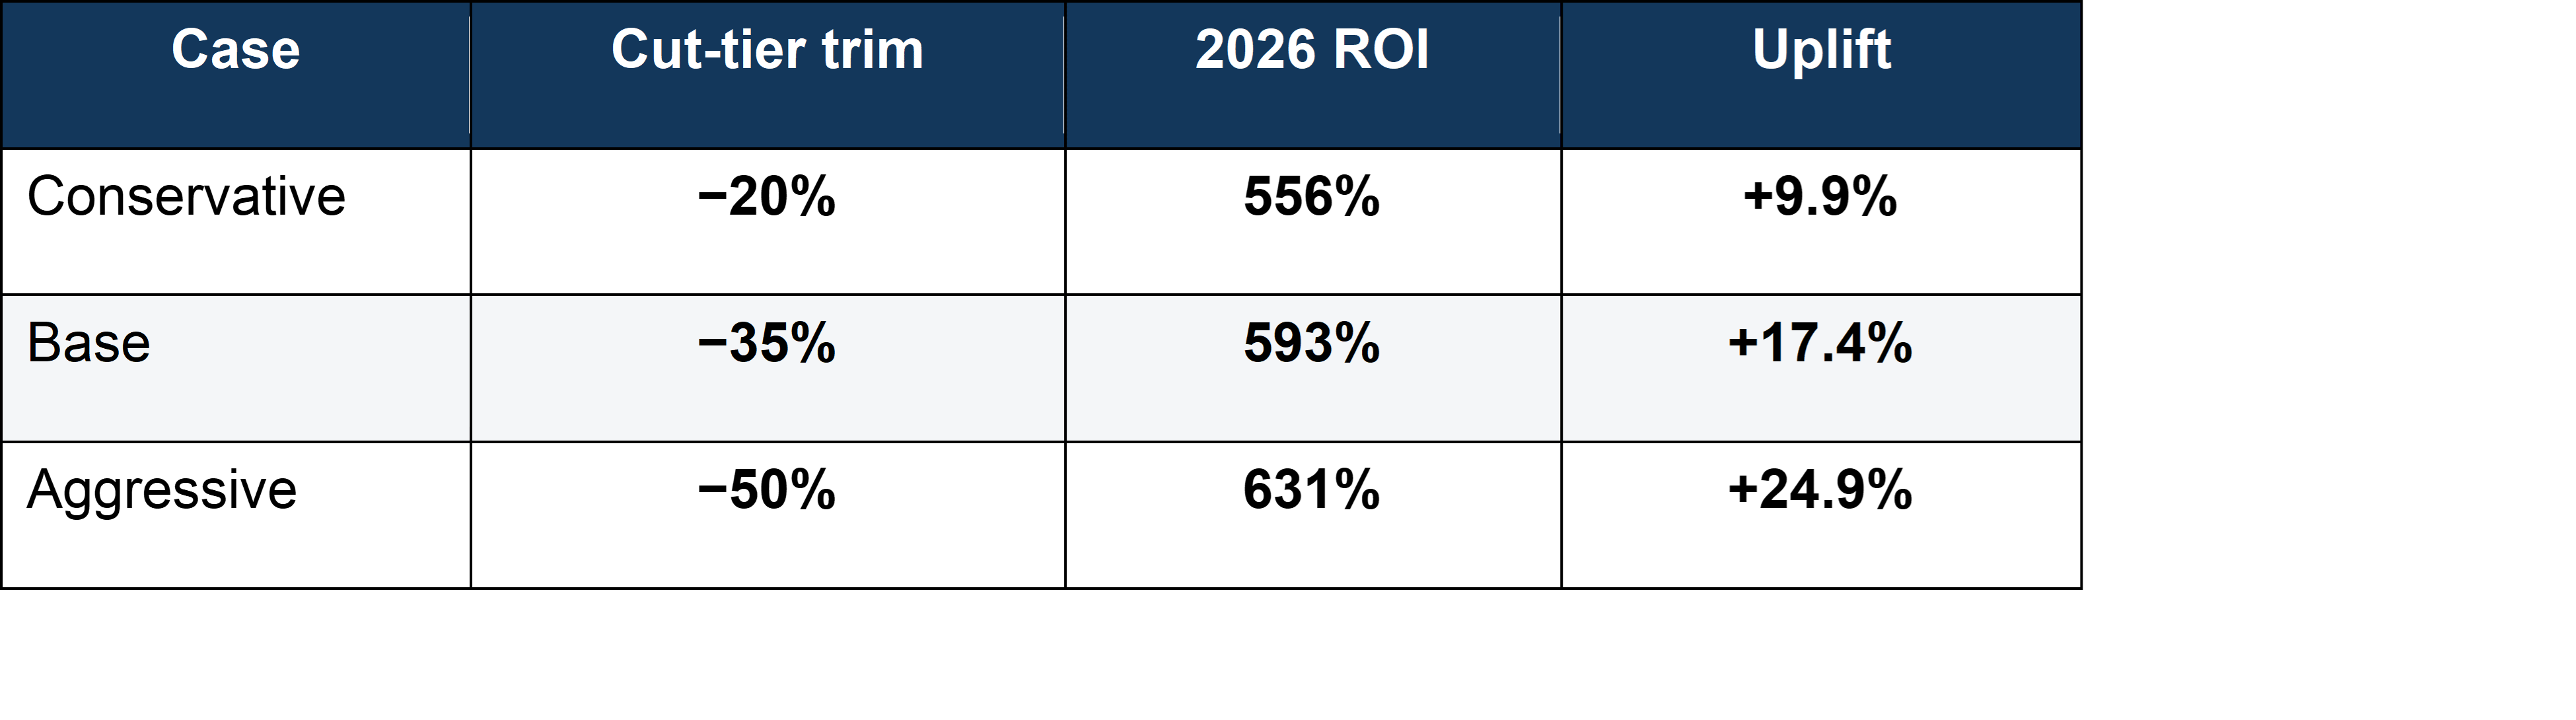
All cases run off the 2025-actual base ROI of 505% and assume no change to lead handling, response time or consultant capacity.
Even the Conservative scenario (+9.9%) is a positive-ROI, net-$0 move.
8. ROADMAP AND RISK REGISTER
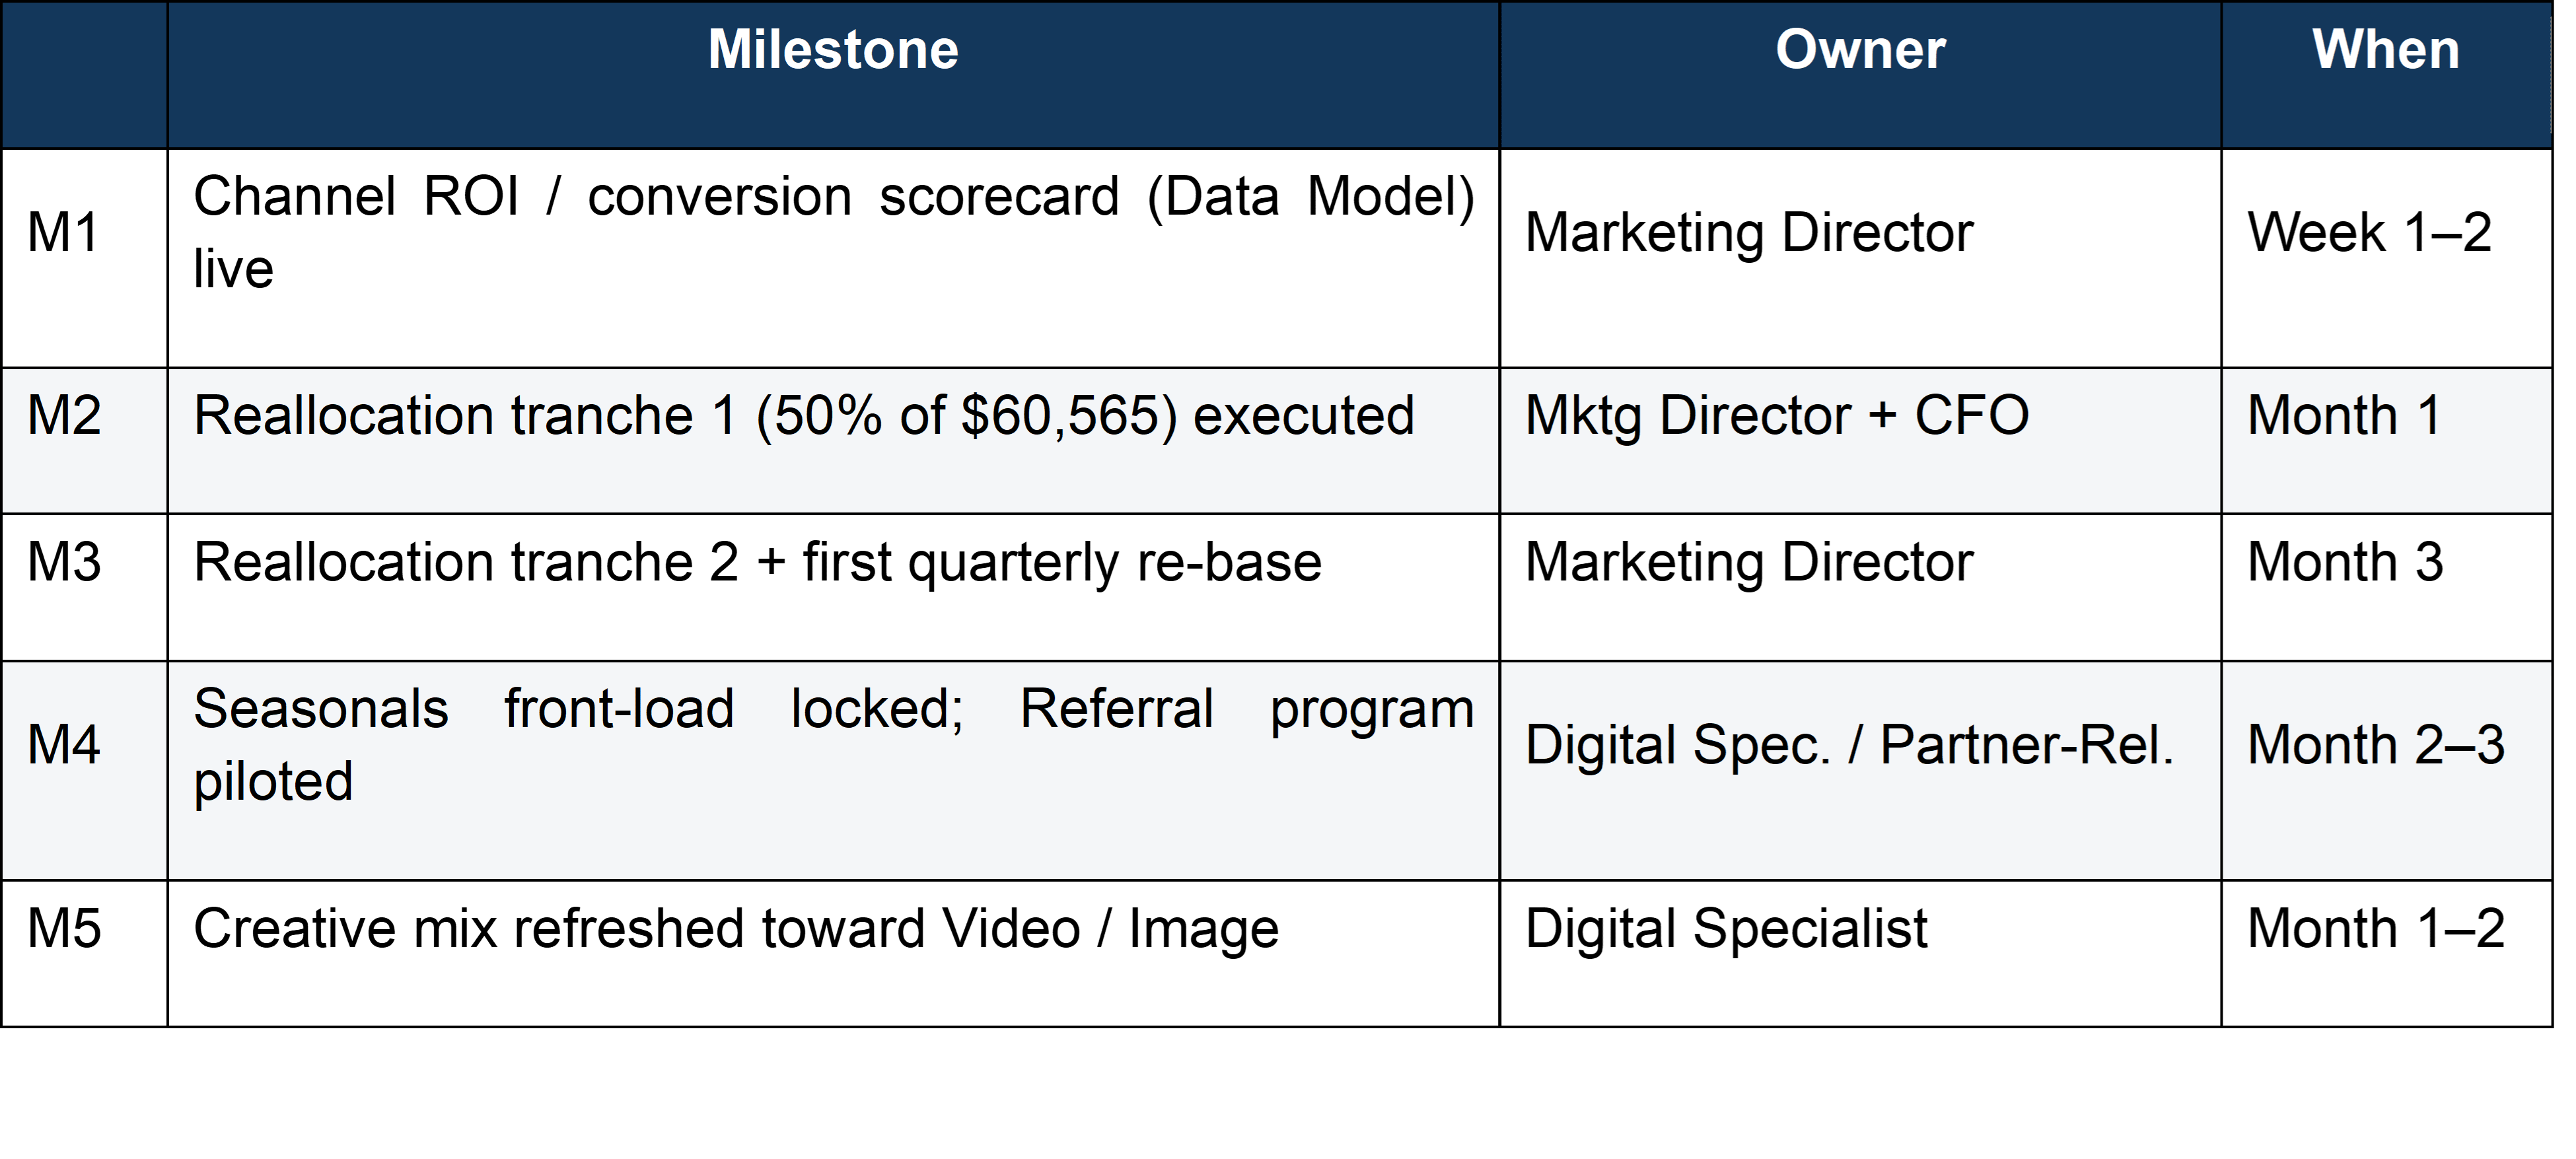
Every move is net-$0 or capital-light; nothing here waits on new budget approval.
8.1 Ninety days, five milestones
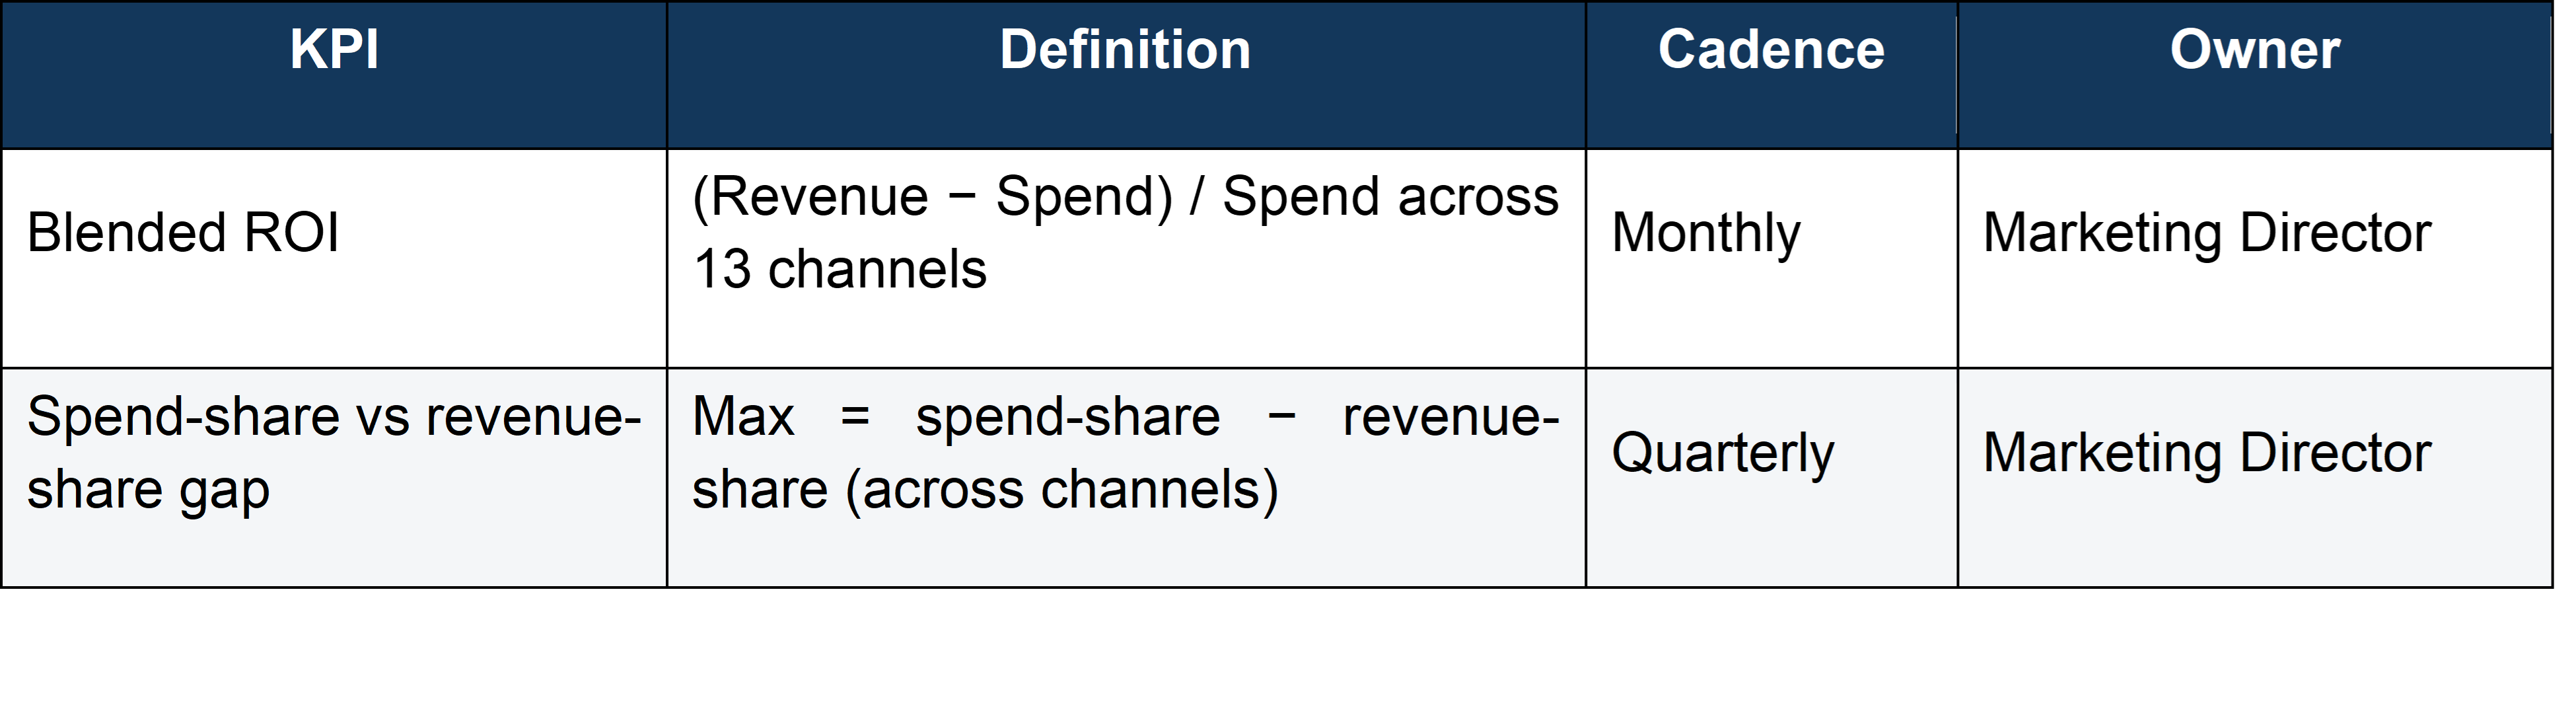
8.2 Two KPIs govern everything
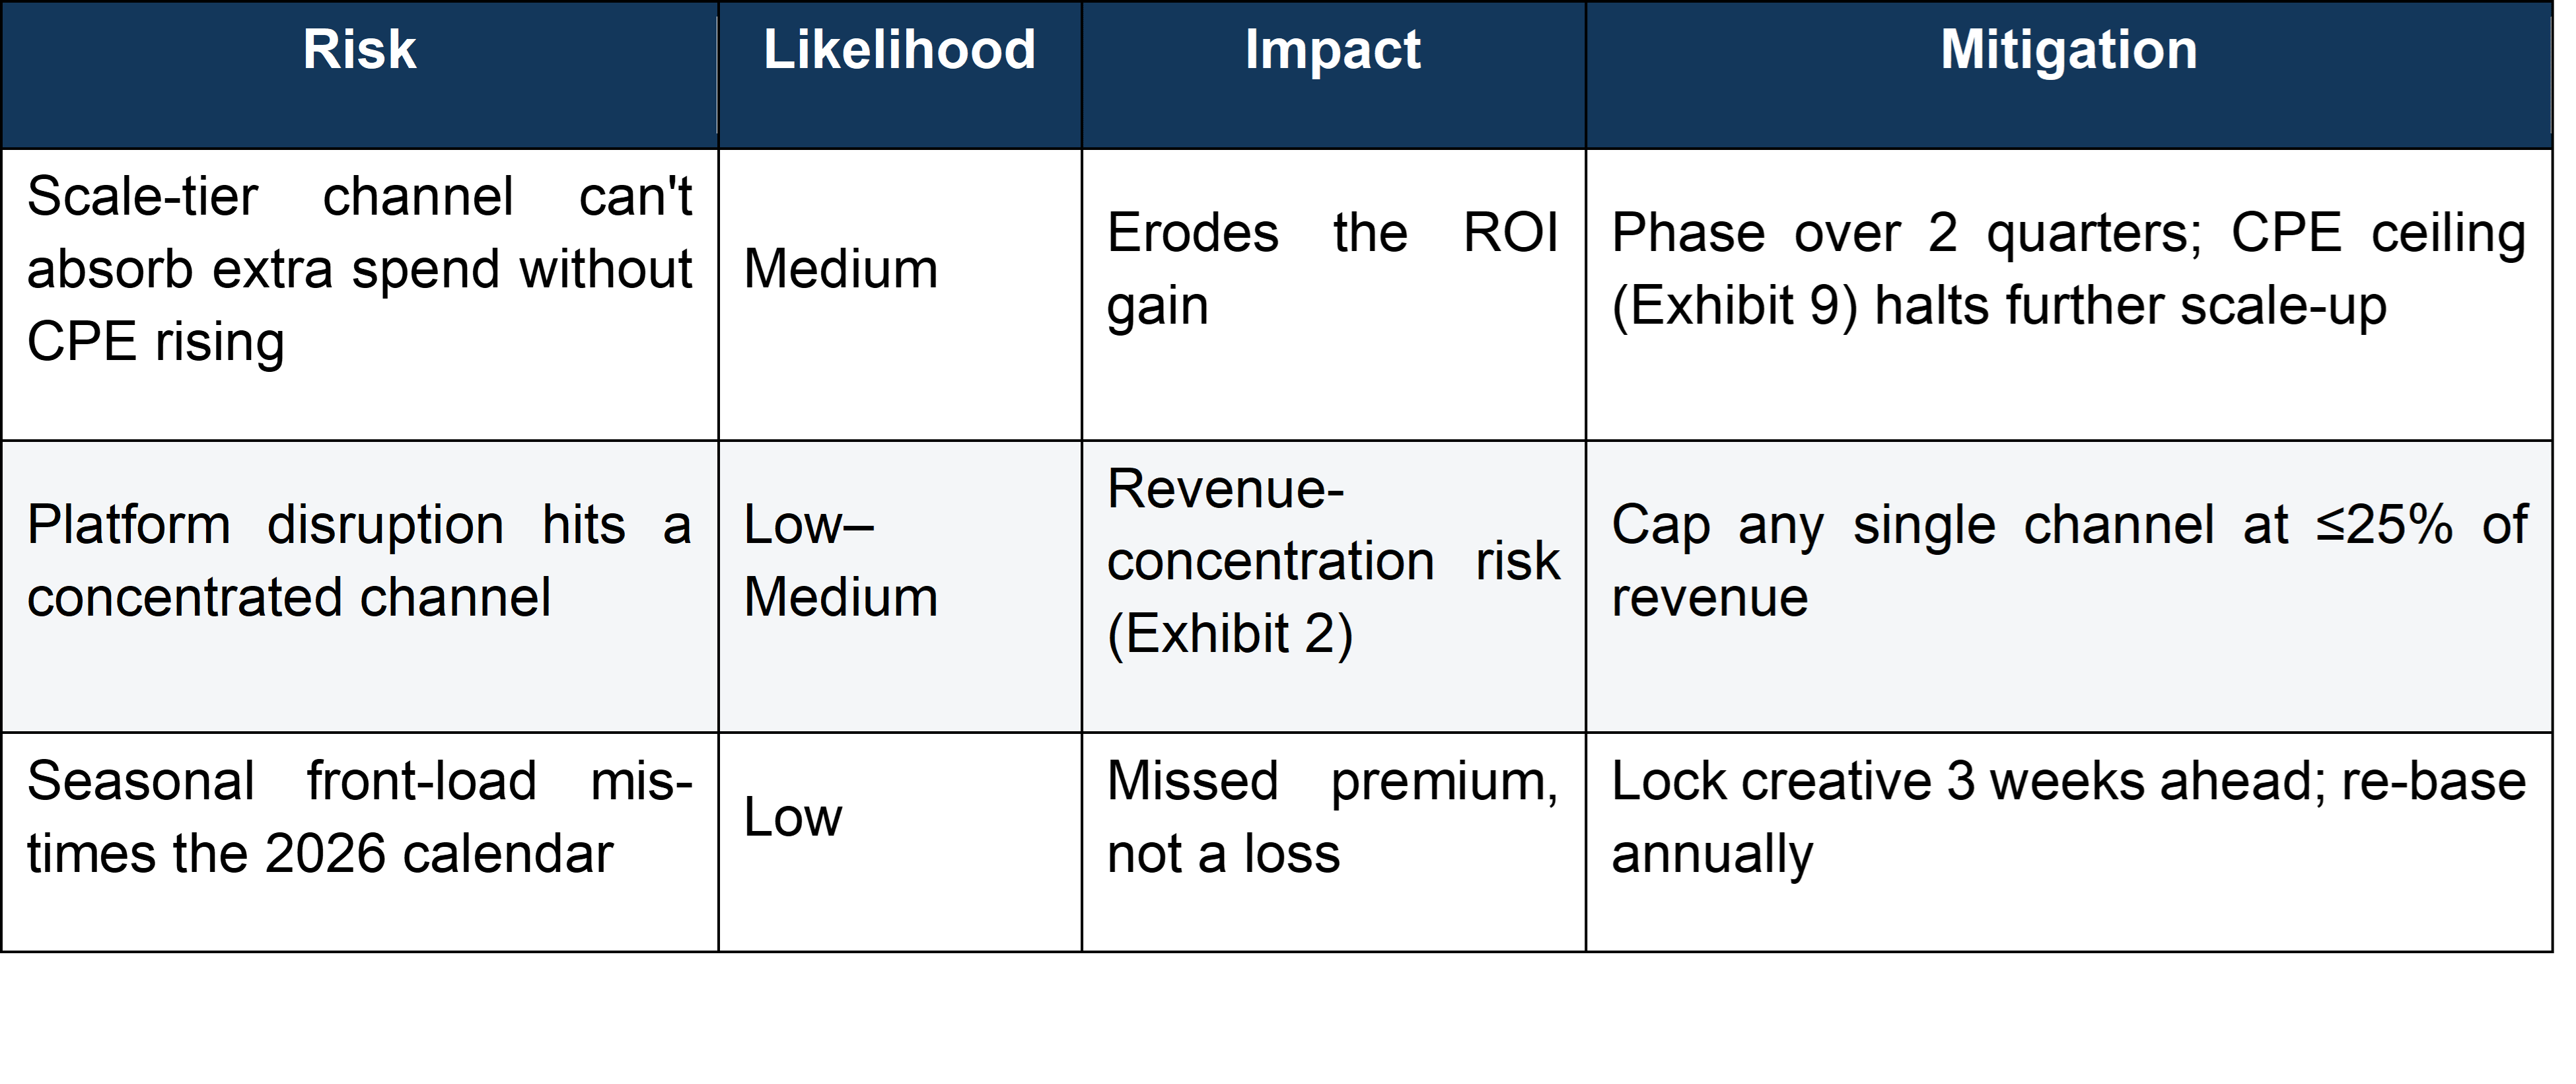
8.3 Risk register
9. APPENDIX
Everything below supports the argument; nothing below is required to follow it.
9.1 Full channel scorecard (13 channels, 2011–25 pooled)
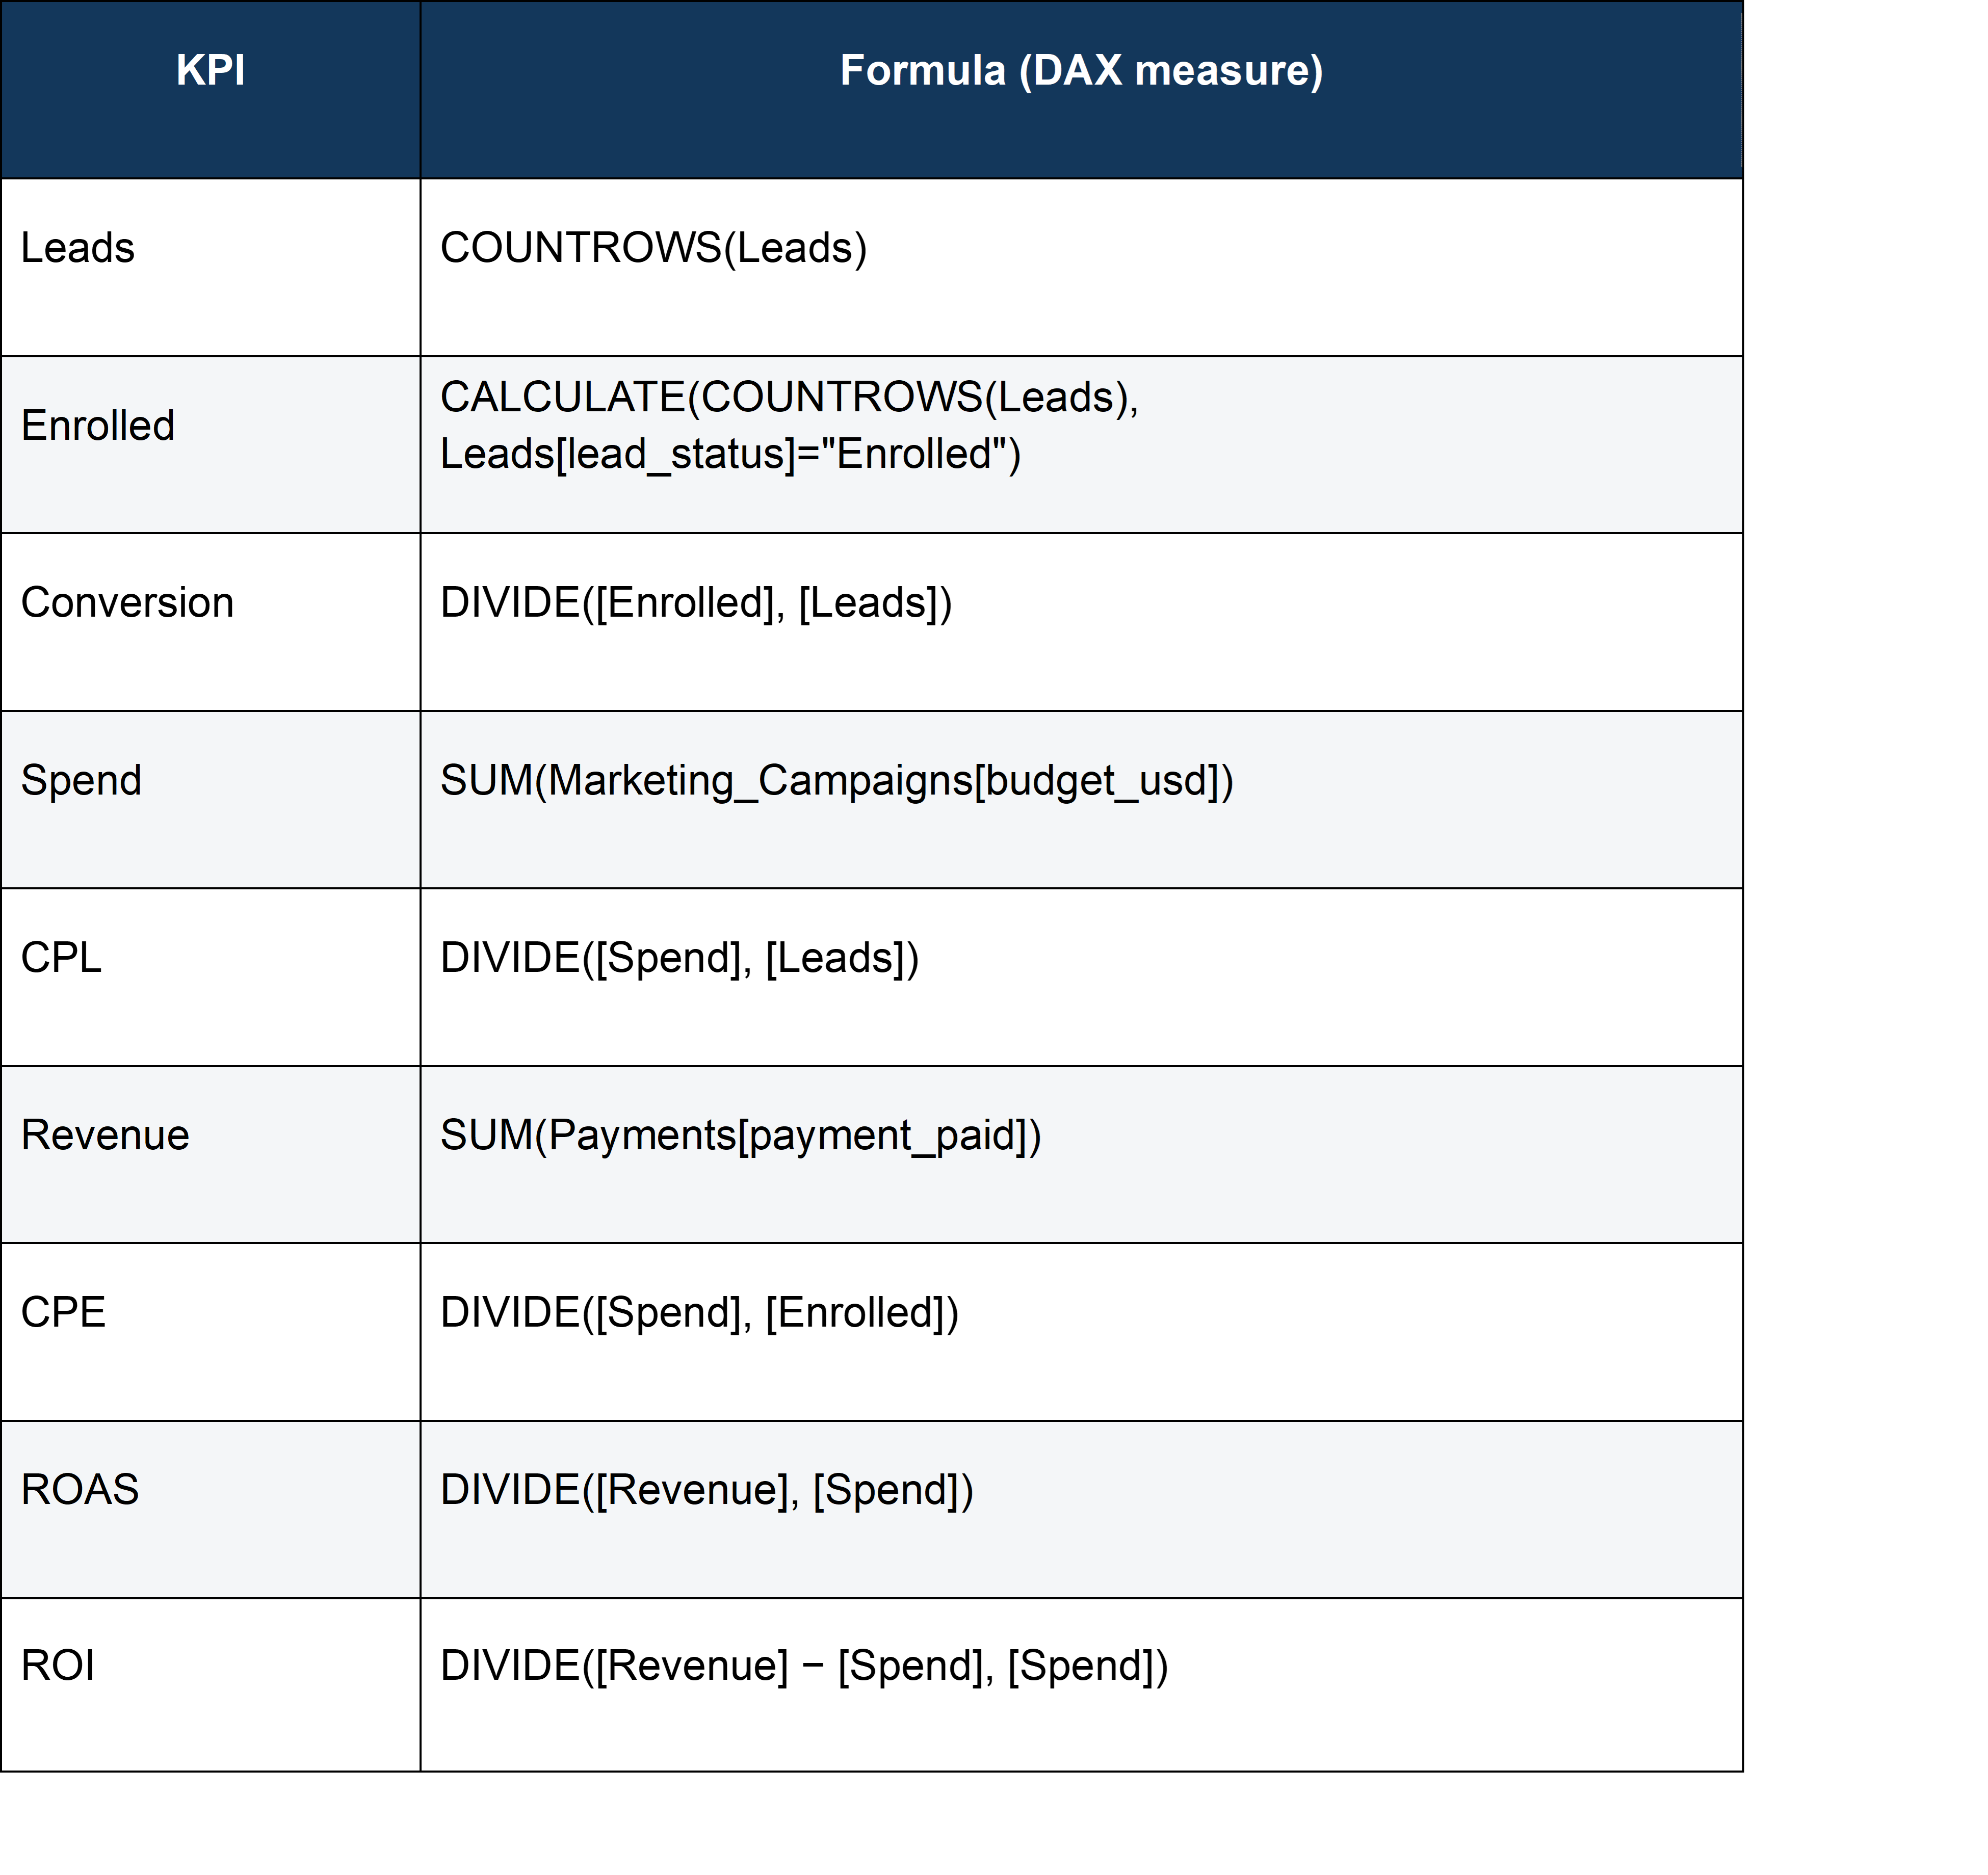
9.2 KPI definitions (DAX measures)
9.3 Data audit & methodology
Built on a live Data Model, verified against ground truth
Every KPI is a DAX measure computed from a Power Pivot Data Model spanning Leads (96,035 rows), Payments (34,693) and Marketing_Campaigns (1,000), related through Lead_Source and campaign_id.
Every headline figure has been independently cross-checked against a direct computation from the raw source data, the two match exactly.
Two spend bases, two questions - do not mix them
$3.75M: the pooled 2011–2025 diagnostic total. It answers “which channels have historically earned the best return?” It is not a budget you can reallocate.
$632K: the real single-year 2025 spend. This is the only correct base for the forward-looking 2026 plan.
The dataset used in this project is synthetically generated, modeled after the structure, workflows, and business logic I worked with in a real industry. All figures, names, and values are fictional and do not represent actual data from any organization. Patterns and trends were designed based on real industry knowledge to demonstrate analytical thinking, not to reflect actual business outcomes
Larry Nguyen